As global temperatures warm, rising sea levels are already inflicting damage on the planet’s coastal regions.
Today, more than 90 cities in the U.S. experience “chronic flooding,” a number expected to double by 2030, according to the World Economic Forum. The flooding will only increase in intensity over time, too — especially if countries don’t curb their global carbon emissions.
The impact of flooding on major cities and more expensive real estate markets has largely dominated coverage of the issue, said Josh Landis, the founder and director of Nexus Media News. “We’ve seen a lot of headlines — ‘Miami lost X billion dollars, Ocean City lost X billion dollars’ — all these big-ticket items that tend to attract headlines,” Landis told IJNet.
This reporting, however, doesn’t capture the breadth of the flooding’s toll on people’s homes and livelihoods. So, Landis has been taking a more comprehensive look at how this phenomenon is affecting all real estate markets in coastal areas of the U.S., using data analysis and visualization.
With funding and data training from Microsoft through one of ICFJ’s inaugural alumni grants, Landis is evaluating which coastal areas are experiencing the most significant financial loss — the highest loss relative to the local area — as a result of rising sea levels. He’s gathering data on property values from the Census Bureau, and cross-referencing those numbers with data pulled from real estate markets on property value loss, from 2005 to 2017.
“What we wanted to do with this was look deeper into the story and find people who may have actually been more affected by this phenomenon than just the very high-end real estate markets,” Landis said.
“These are places that tend to be less touristy, less household names,” he added. “They’re places where people have a lot of their personal wealth invested in real estate, which is now being affected by climate change-induced losses.”
As a result, they have fewer resources to fall back on should sea level rise damage their property.
“I think one of the big things at stake for them is not getting as much out of their home investment as they had hoped,” Landis said. “Selling for retirement planning purposes, or refinancing, or using to help pay for kids' college expenses — those are things that are at stake. Not to mention losing properties outright to extreme weather and flooding.”
Landis and the two others on his team have pulled data from “thousands and thousands” of zip codes along the majority of the U.S. Atlantic and Gulf coastlines, from Maine to Texas. They have, in turn, set out to analyze and visualize the complex data.
To make that complexity easier for his audience to understand, they have created powerful visuals using Power BI, business intelligence software that helps transform data from numbers into visual forms that help tell a story. Newsrooms such as the Associated Press, Politico EU, and even a TEGNA TV station have also utilized this software to tell stories with their data, improving audience engagement and comprehension.
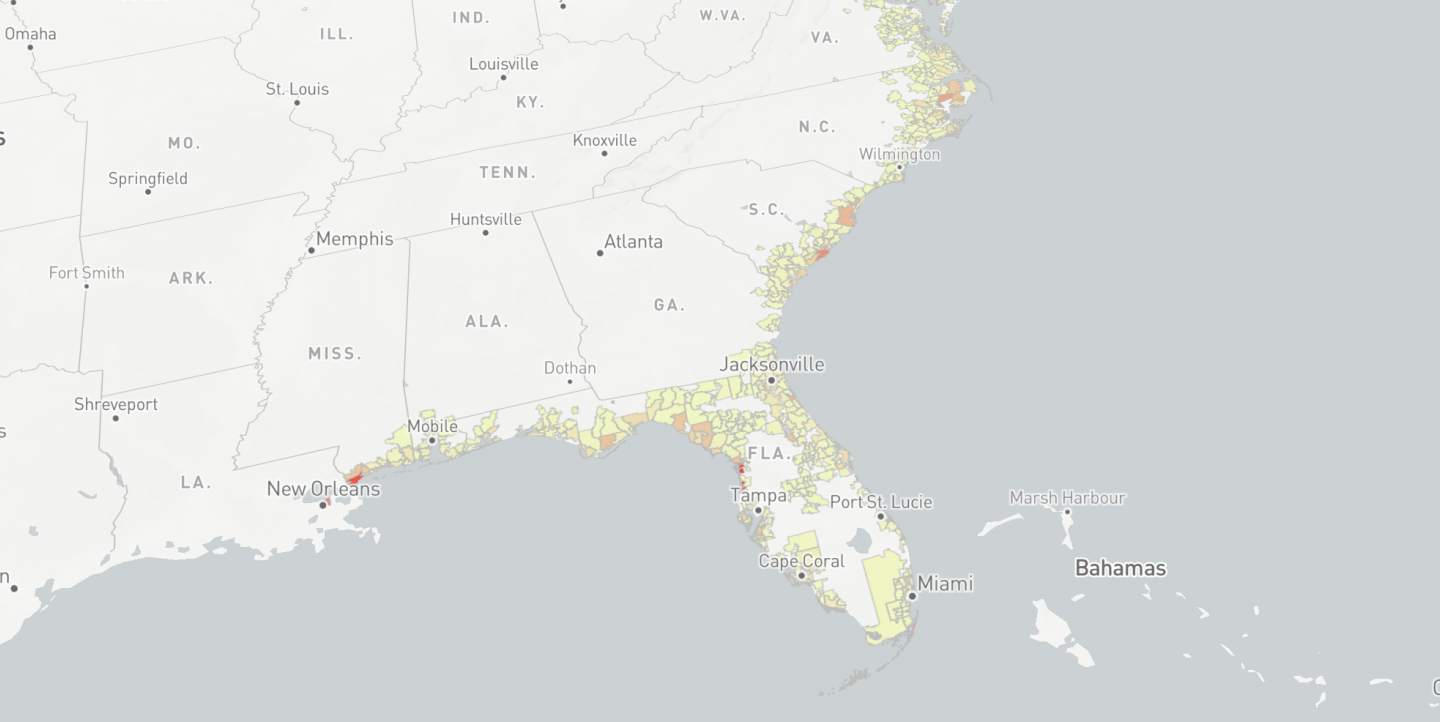
“We created a map where you can zoom and pan, and you can click on different zip codes, and you can see the loss ratios coded by color, and explore all of it if you want to,” Landis explained.
Landis and his team found that the places hit the hardest are not necessarily the ones with the largest property loss values overall.
“If you have a property that’s worth US$10 million and you lose US$500,000 off that value, that’s a much different impact than if you have a place that’s worth US$1 million and you lose US$500,000 off it, or you have a place that’s US$200,000, and you lose US$100,000 off it,” Landis explained. “Just looking at the value alone doesn’t tell the whole story, which is why we turned to this data analysis.”
Take Bay St. Louis, a small town of 13,000 along the Mississippi Gulf Coast. Property value loss may seem low there at first glance. When taken into context with its low property values, however, the impact is actually harder on homeowners.
Only when Landis and his team were able to place raw numbers in a visual format did that impact jump out to them. They plan to travel to Mississippi to meet with homeowners and real estate professionals, to put faces to the data.
Nearly 700 U.S. cities could be under “chronic inundation” by the end of the century, the Union of Concerned Scientists warns. As the flooding intensifies, it’s towns like Bay St. Louis that stand to benefit from more media attention. Landis hopes his reporting will illuminate the significant impact that the climate crisis has, and will continue to have, on the property values of small communities.
This way, they can “take appropriate action,” he said.
“Whether that’s protecting the community or reassessing their investments in the community — whatever the appropriate reaction is in their minds, [we want to] raise the appropriate awareness.”
More and more newsrooms are incorporating data journalism in their reporting today — as Landis has found, learning to dig deep to analyze numbers is a kind of large-scale investigative reporting that can yield deeply personal narratives within a community.
“Without the deeper analysis of the data, you would miss interesting, important and original stories,” Landis said. “That’s what every journalist wants to find.”
You can learn more about Josh Landis' work, and ICFJ's alumni grants here.
Main image is a screenshot from Josh Landis' reporting with Power BI data visualization software.


