In the current news environment, journalists and developers are increasingly calling upon and benefiting from one another's skills and expertise.
The nearly one-year-old InfoAmazonia is a product of such a partnership–and a testament to the power of collaboration. Funded by media development NGO Internews and led by Knight International Journalism Fellow Gustavo Faleiros, InfoAmazonia presents environmental news and maps of open data in Portuguese, Spanish and English from the nine-country Amazon region. InfoAmazonia’s maps are data-rich and cover issues ranging from deforestation to extractive industries.
The Washington-based company MapBox built the developer tools for the InfoAmazonia site. During InfoAmazonia’s development, MapBox provided site strategy, Web design and cartography, as well as training for journalists in Brazil on how to use the site’s tools.
At InfoAmazonia’s base was a lot of data – more than a dozen sets – from the Amazon. The site’s goal was to create an attractive visual representation of the data while keeping the focus on the stories that put the data in context. To achieve this, Faleiros worked with MapBox developers, namely senior developer Alex Barth.
Barth’s design proposal brought story headlines to the forefront, which was something most digital maps didn’t offer. The partners created a user-friendly design, which presented news articles on a map near the top of the page.
To visualize the troves of data, they turned to extensive and data-rich “layers.” Each layer is a visualization of a single data file or database query. Multiple layers can be combined on top of one another to create a final, data-rich map.
TileMill is MapBox’s open source project for complex custom maps featuring data sets. It allows for more advanced data importing, styling and design than you’ll find on more basic online maps.
InfoAmazonia gave MapBox a chance to test out and improve TileMill’s cutting-edge features, like UTF-8 grid technology, which allows users to quickly interact with more than a half-million data points representing deforestation across the Amazon Basin.
Other maps rely on TileMill’s image compositing functionality, which allows developers to control the way colors and textures of different elements and styles interact with each other.
“Originally, we were really trying to pack as much data as we could into a map, without testing design solutions,” Faleiros says. “So the fact that MapBox forces you to think about so many details to make their maps also enhances that map as a communication tool.”
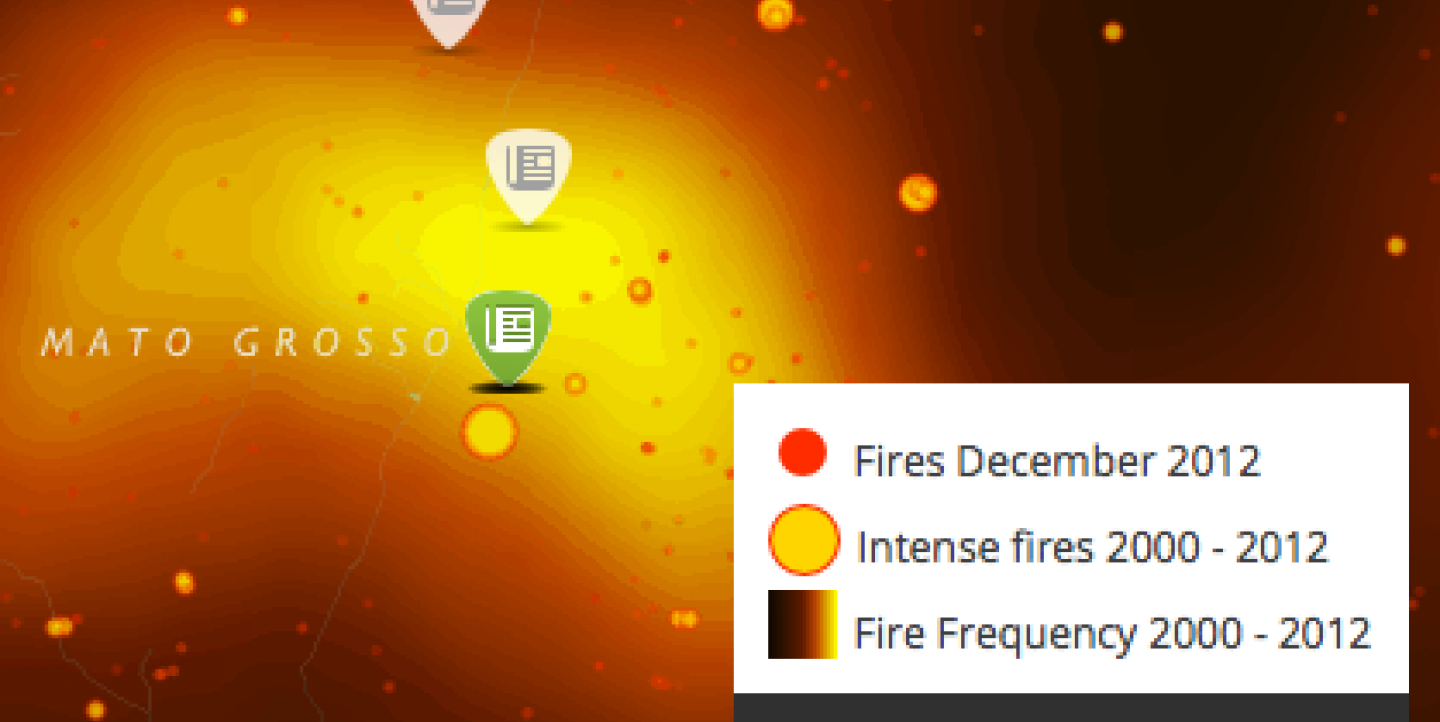
The front-page map displays data on forest fires, mining, oil and gas, deforestation, and more. Because the map of fires has so many data points, Faleiros said it originally looked as though the region as a whole was burning. After realizing the design was telling the wrong story, MapBox proposed a time analysis on the data.
Not only did it look better, the design “has proven to be very effective in discovering patterns of areas of Brazil and Bolivia that had more forest fires over the years,” Faleiros says.
For MapBox, helping build InfoAmazonia gave new insight on the needs of users, especially those new to mapping. A key component of InfoAmazonia’s launch was an extensive training program.
“InfoAmazonia was a great reminder of how complicated geographic information can be,” Barth says. “Pitfalls like dealing with geographic projections were important to address early when training teams unfamiliar with managing geographic information.”
As Faleiros sees it, the result of such a partnership is more powerful communication of what’s happening in the Amazon rainforest to the world.
“There is no way that a product like InfoAmazonia would be entirely made by journalists,” Faleiros says. “So bringing programmers, data analysts and others to the project have made it much better. The impact and usefulness of journalistic products improves when done along with developers.”
Image: InfoAmazonia's fires map, courtesy of InfoAmazonia.

