A growing number of journalists and media outlets today use data journalism to break down large amounts of information. When we start our mornings off with the latest numbers around COVID-19, it’s especially important to find effective ways of conveying data to our readers.
While universities in Eastern Europe, Central Asia and Transcaucasia currently offer few data journalism programs, the discipline is attracting an increasing number of journalists in the region.
IJNet spoke with industry experts to learn how best to get started and excel as a data journalist today.
Getting started
Kyrgyzstan-based data journalism trainer Altynay Mambetova began her journey in data reporting by reading data articles published in U.S. and British news outlets.
“This was data-based investigative journalism. The stories inspired me; I hadn’t seen anything like this in Kyrgyzstan. Nobody did it,” she said. “I began to study the field in depth, and then we began to invite coaches and hold training sessions for Kyrgyz journalists.”
Today, Altynay is the founder of the School of Data Kyrgyzstan, a public foundation that promotes data skills in the region.
[Read more: Using data journalism to cover the pandemic in Latin America]
In Georgia, data expert and ForSet co-founder Mariam Gamkharashvili said that she was motivated by the appeal of stories that contain visualization components.
“I remember I found a study that claimed that people absorb almost 90% of information visually,” she said. “That’s when I realized that this is what I want to do.”
Today, Gamkharashvili manages educational projects for journalists and political activists. She has taken part in various data visualization projects, and social campaigns that utilize data.
“I believe that I was in the right place at the right time,” said Gamkharashvili. Her first job was with JumpStart Georgia, the first Georgian organization to begin utilizing data for communicating with readers back in 2012. “At first, I was more engaged with research, but soon I realized that it’s important to communicate the results of these studies. If you fail to communicate the information correctly, all work loses its meaning,” she said.
Anton Devyatov, a data journalist and special projects producer from Belarus, began his career by taking on any work that had a visual component.
He decided to try his hand at data visualization, and began to read books and explore the relevant software. He later sent samples of his work to TUT.BY online media and freelanced. He did information visualization in parallel with his daytime job as an engineer.
He soon found that he was spending more time on data visualization than on design engineering. It became clear that something had to change, and he joined TUT.BY full time. He has been with the outlet for the past five years now.
“Since then, I’ve mastered many different techniques of data visualization, and in recent years I’ve been producing special projects,” said Devyatov.
Improving your skill set
Gamkharashvili recommended that you should be constantly reading. It’s crucial to study your colleagues’ work, she said, and to keep track of shifts in data journalism.
“Choose the outlets you like and follow them,” she suggested. “Large organizations have more resources to experiment with, which is very important in this field. Of course, many experiments may fail, but that’s also a part of the process.” She added that Facebook groups can also be a valuable resource for exchanging knowledge with peers.
Gamkharashvili explained that ForSet organized Data Fest Tbilisi, the first event of its kind in the region, to bring data journalism experts together. For several years now, this network has been a resource for study and exchange of knowledge, she said.
Yaryna Serkez, a graphic designer and editor at The New York Times originally from Ukraine, encouraged fellow data journalists to dedicate themselves to learning, venture out of their personal comfort zones and, if possible, study fields beyond traditional journalism. This might include programming, statistics and cartography.
In 2015, Serkez received a Fulbright scholarship to study in the U.S. She went on to earn a master’s degree in data journalism at the University of Missouri.
“I began as a regular journalist. I had no training in software programming or statistics. My first visualizations were static, and I clearly saw the limitations of this format, which is why I really wanted to get additional training,” said Serkez. “In addition to the study program in the U.S., I took part in many workshops, master classes and conferences. I do this even now, because our industry is very dynamic. Every day you have to learn something new.”
[Read more: Using data to illustrate COVID-19's impact on vulnerable communities]
Challenges
Every serious project presents its own set of problems, said Devyatov. “The worst that can happen is to make a mistake at the early planning stages. For example, you may lose sight of the trend’s viability, invest in something labor-intensive, and by the time the story is out nobody cares for it,” he said.
Devyatov noted that there is almost always a problem with data quality. All data must be obtained, verified and cleaned.
“If the data only raises a few questions, then you’re in luck. More often, it’s in terrible condition,” he said. “We are usually happy when there is at least some data that we can obtain, as it’s easier to sort out the issues with quality than to deal with the absence of information. If there’s nowhere to get the data from, but we have deep interest in the subject, we ask our users to share information.”
He continued: “A recent example is this poll about remote work and office life. We collected over 12,000 completed questionnaires and gathered a lot of interesting findings.”
For Gamkharashvili, the most difficult aspect of the work is finding the happy medium in how to present information. While it should be comprehensible for readers, journalists shouldn’t simplify the data too much.
“Another problem is that many projects are billed as data journalism, but data doesn’t play a key role in them. For me, that just shows that they are simply being trendy,” she said.
Gamkharashvili abides by the following criteria: if an article is able to stand on its own even after data is removed from it, this is not data journalism. The most important component of data journalism is the data, not the personal stories.
Specialization within data journalism
In 2017, Evgenia Drozdova began working at Texty.org.ua, a well-known data journalism platform in Ukraine. The outlet was founded in 2010 and has received a number of prestigious awards, the latest of which being “Best News Application” at the 2020 Sigma Awards.
“The majority of people on our team are universally skilled, capable of collecting and analyzing data, writing text, visualizing information and conducting a project layout,” said Drozdova. Developing a project involves a wide variety of activities. This versatility offers a major advantage as it provides protection from burnout, she said.
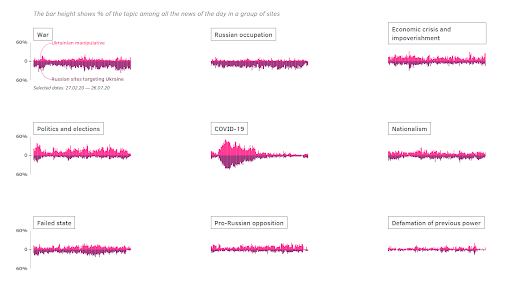
“On average, the work on a project lasts a few months. Sometimes it takes longer, however,” said Drozdova. “For example, we worked for almost a year on one of our latest analytical pieces about the spread of populism in Ukraine, because the greater part of the data had to be cleaned manually. This is a story about the ways that Ukrainians’ voting preferences have changed since 2006, with a breakdown by polling station.”
According to Gamkharashvili, ForSet used to employ experts with different skill sets to work on a story. One person did the research, another designed the visuals and still another wrote code. “However, today we are seeing a trend towards one person doing everything: research, interviews and code. I can’t say what’s more efficient,” she said.
She added that editors are on the hunt for specialists with these unique skill sets. You have to be careful, however. While someone might know a little bit about everything, they could lack the in-depth knowledge that’s so important in the field, she said.
Recommended resources
The journalists interviewed all agreed on one thing: in data journalism, it’s critical to constantly look to build on your skills. Devyatov and Serkez offered resources helpful for doing just this.
Devyatov’s recommended books and resources:
- For journalists starting out in data journalism: Gene Zelezny’s Say It With Charts Complete Toolkit and Dan Roam’s work on visual thinking.
- Edward Tufte’s Envisioning Information
- The Wall Street Journal’s Guide to Information Graphics
- Stephen Few’s Show Me the Numbers
“It’s also great to read things from related industries,” Devyatov said. “Alexandra Korolkova writes accessibly about typography in her Living Typography, and so does Artem Gorbunov in Typography and Layout. Another book about layouts is The Art of Color by Johannes Itten.
Books recommended by Yaryna Serkez:
- Dear Data, by information designer Gorgia Lupi and data designer Stefanie Posavec. This book is helpful for journalists who want to make progress in this field but have not been trained in how to analyze large amounts of information.
- The Functional Art: An Introduction to Information Graphics and Visualization, by Alberto Cairo. This book is helpful if you’re just starting out in data visualization.
- The Visual Display of Quantitative Information, by Edward Tufte.
- Information Visualization: Perception for Design, by Colin Ware. This is useful for journalists with some experience in the field.
- The annual Malofiej books. These contain analysis of the best visualizations of the year.
Mariana Verbovska is a journalist at ZAXID.NET, and a freelance contributor for IJNet Russian.
Main image CC-licensed by Unsplash via William Iven.
إقرأوا المزيد من المقالات لـ