This article is part of our reporting series on COVID-19. For more COVID-19 resources, click here.
The media industry is certainly not lacking content during the COVID-19 crisis — far from it. Journalists have shown innovative ways of reporting on the pandemic. Reporters in Latin America are no exception as they document the events happening in the region, where healthcare systems are struggling under the strain of COVID-19.
Below we spotlight data-driven projects created by Latin American media outlets and civil society organizations at a time when reliable information is more important than ever.
[Read more: The role of solutions journalism in reporting on COVID-19]
Chile
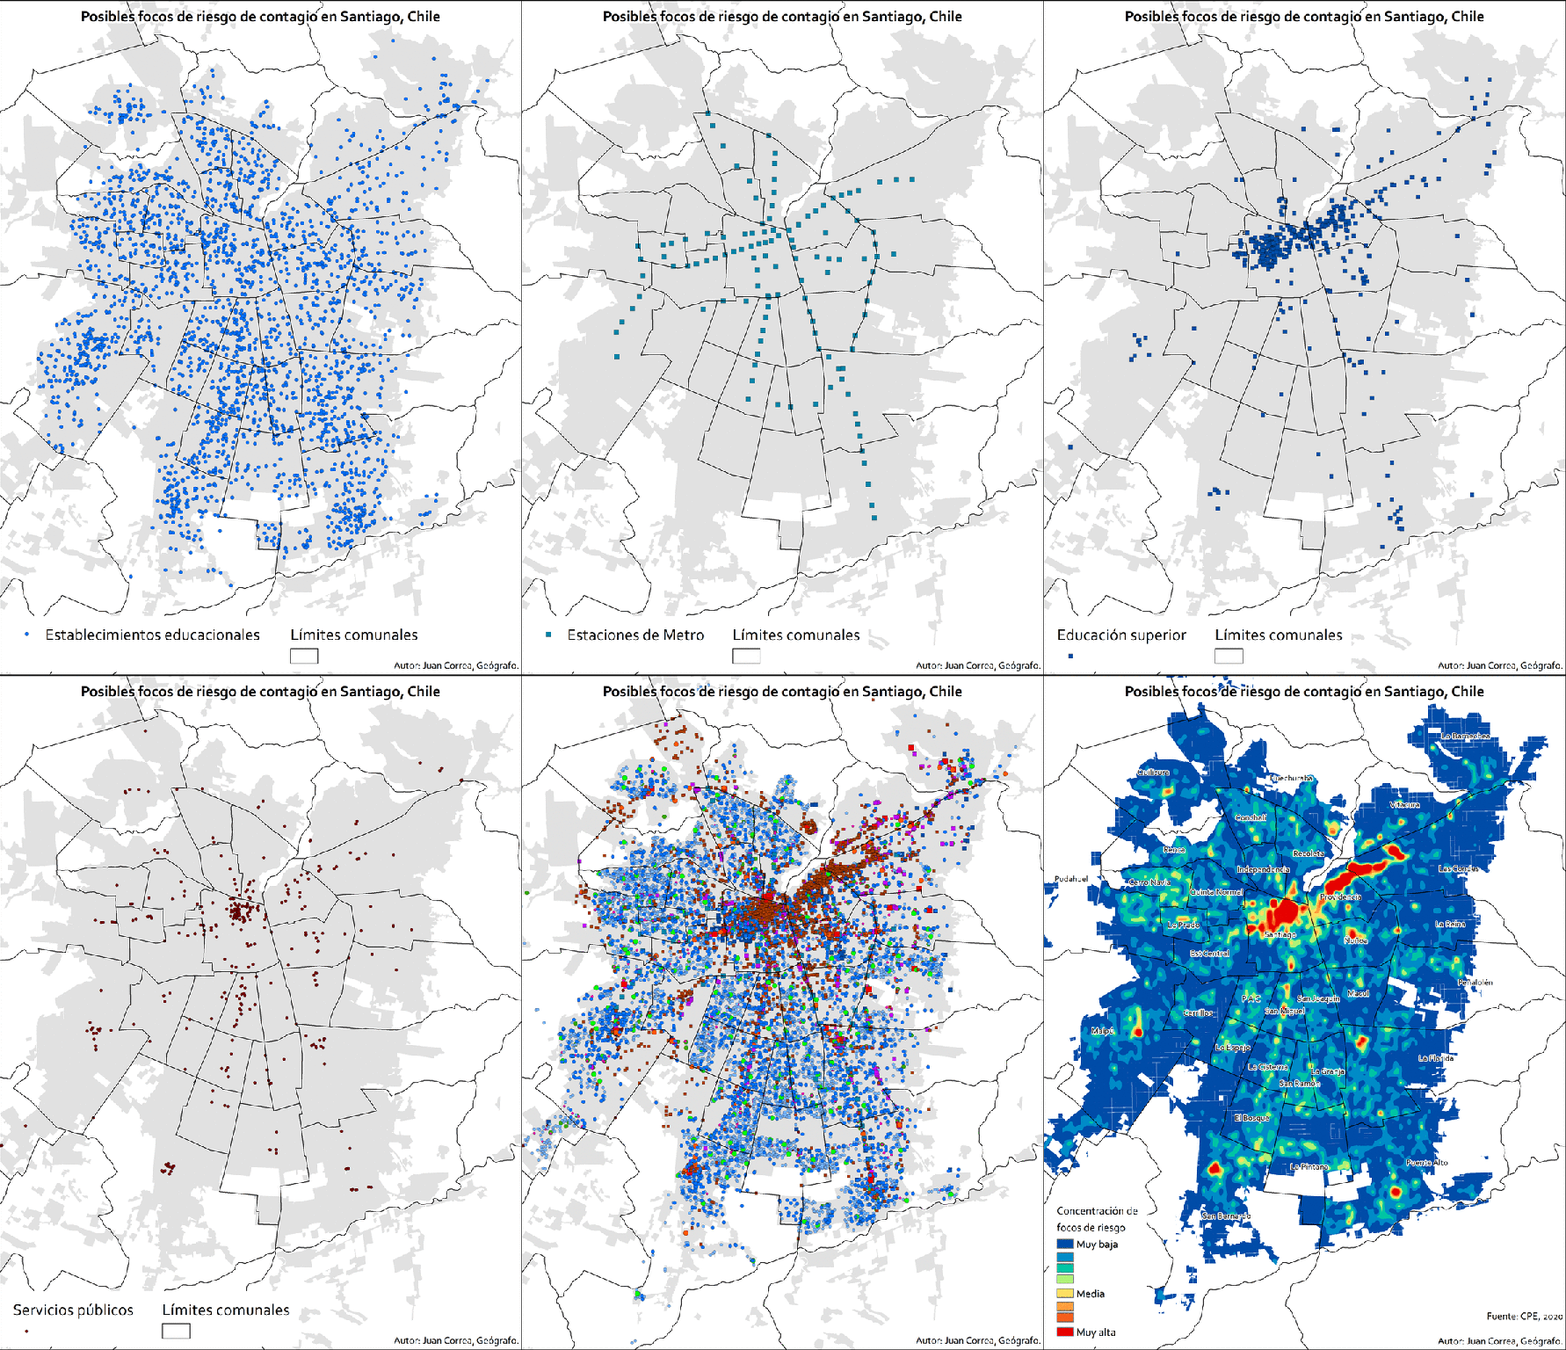
The Centro Producción del Espacio, the research unit for the Universidad de las Américas’ School of Architecture, Design and Construction, created a map of Santiago illustrating the areas of the city most prone to the spread of COVID-19.
The map highlights places where people might find themselves in close quarters, “Areas where people congregate for various types of interaction (social, commercial, cultural, etc.),” the article explains.
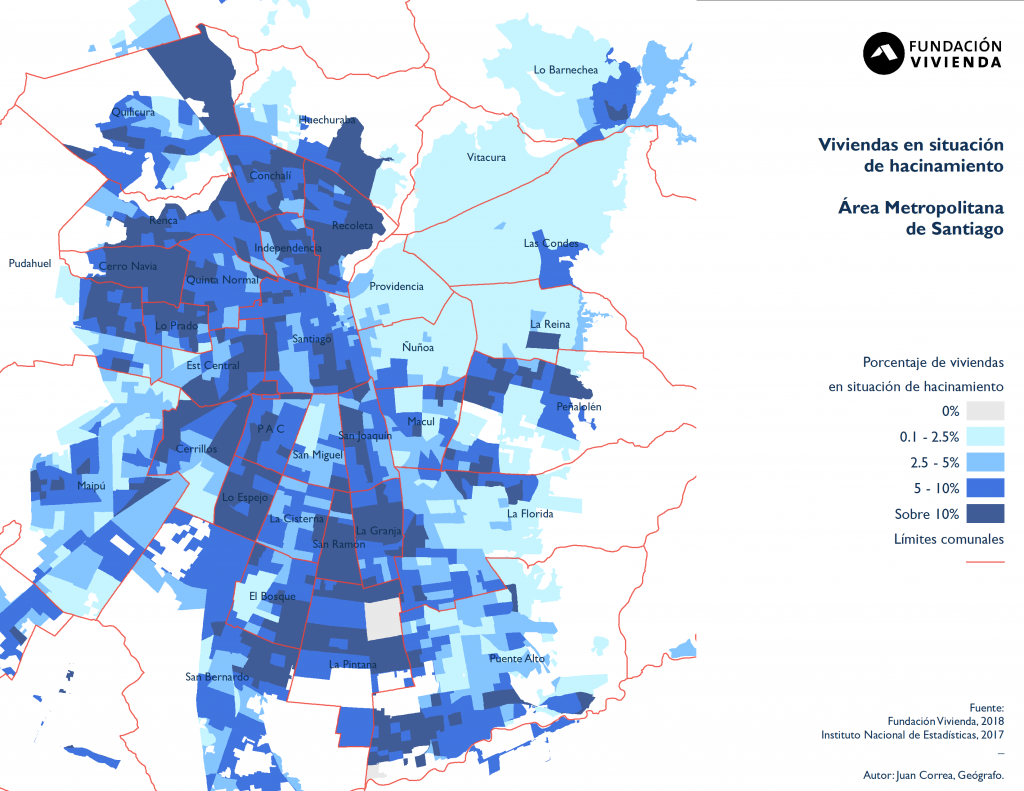
The Fundación Vivienda, a Chilean NGO, also used data about Santiago to create several maps analyzing the city’s preparedness in the face of the pandemic. The maps draw attention to factors which can influence the spread of COVID-19, and illustrates elements such as the shortage of houses in Santiago, the number of overcrowded homes and the time it takes people in various neighborhoods of the city to commute to work using public transportation.
Argentina
The data team at La Nación has used the current global situation to put together a project that is not exactly a data project per se, but was nonetheless inspired by a database created by the publication’s data team. The project illustrates how Argentines have been stranded around the globe — one of the repercussions of strict measures implemented to combat the pandemic in various parts of the world.
The data team at La Nación created a form for any of the 23,000 Argentines stuck abroad to fill out to share their story. They used the responses to write an article sharing individual experiences of Argentines stuck abroad. The story includes details such as when the individuals found themselves trapped abroad, where they were stranded, and any other specifics about the situation in which they found themselves.
Brazil
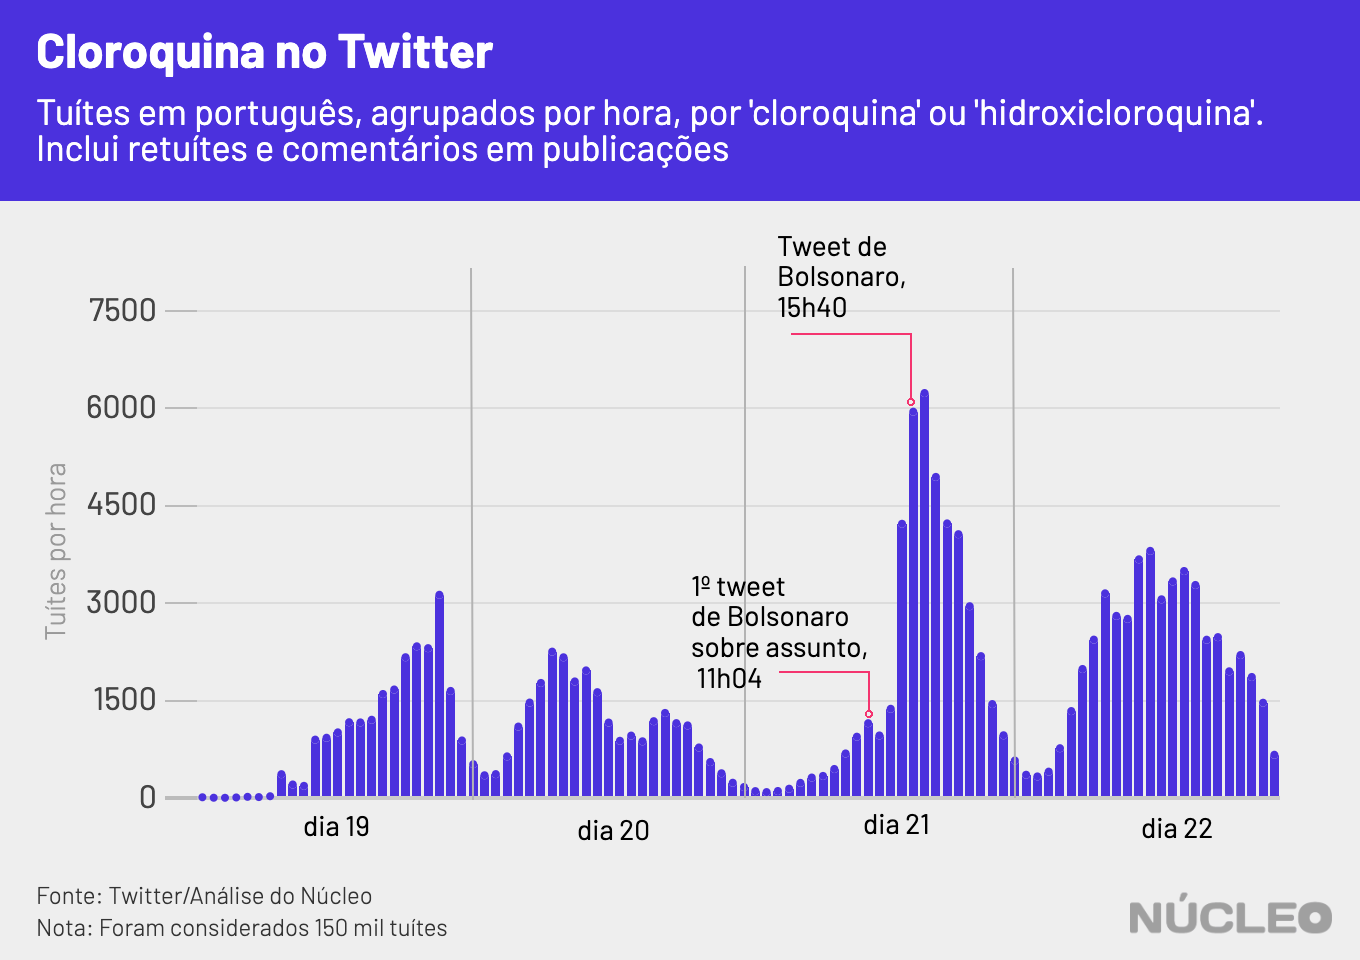
Nucleo, a Brazilian data journalism website, is providing coverage on a wide variety of topics related to the pandemic. One angle of their work includes stories about Jair Bolsonaro, Brazil’s controversial president, who has repeatedly dismissed the dangers of COVID-19. As one example, Bolsonaro insists a drug called chloroquine, primarily used to treat malaria, helps cure COVID-19, although there is no scientific evidence proving its effectiveness. The Nucleo team decided to show how Twitter and Google searches for chloroquine spiked after Bolsonaro promoted the use of the drug to treat COVID-19.
Peru
Ojo Público looked into a largely unexplored aspect of the pandemic: who imported surgical masks and N95 respirators to Peru, how much did importing those goods cost and how did they do it?
The team’s research revealed that six companies made 66% of the purchases, and 88% of the imported goods came from China. Three out of the six largest suppliers of the imported goods were from Hubei, the province in China where the pandemic began. In totalotal, the team at Ojo Público discovered that the imported face masks and respirators bought by Peru in January and February amounted to US$773,000.
[Read more: How are newsrooms keeping readers informed on COVID-19? Here are some examples from around the globe]
México
Tukan, a website dedicated to access to public records in Mexico, published a data-driven article on the infrastructure of Mexico’s public health sector as it faces the COVID-19 crisis. The Tukan team analyzed the number of doctors in Mexico, and how many hospital beds there are for every 1,000 residents.
In a painstaking, municipality-by-municipality analysis, they also examined how those hospital beds are distributed geographically across the country, and the type of beds available — for hospitalization, intensive care or something else.
The Tukan team then laid out four possible COVID-19 scenarios in Mexico’s future: with possible infection levels of 0.01%, 0.10%, 1%, or 10%. They mapped out the scenario in each region of the country, and explored which hospital beds would start to run out.
¿Tenemos los recursos suficientes para enfrentar al #COVID19mx ?
— TUKAN MX (@MxTukan) March 26, 2020
Visita nuestro estudio acerca de la infraestructura física del sector salud público en México, con datos a nivel municipal de la Secretaría de Salud.
Link aquí 👇https://t.co/Wfm2aHvVOH pic.twitter.com/DFzg3oRN2x
Colombia
Similar to the reporting by Tukan in Mexico, El Tiempo in Colombia published a story on the availability of beds in intensive care units by region. The story analyzed which areas of the country had the most — and least — intensive care beds available.
According to the data produced for this project, there are five regions of the country which do not even have one intensive care unit bed for every 10,000 residents. The municipality of Arauca only has four intensive care hospital beds for the entire area, which is a population of 270,000 people.
DataSketch also launched a website for coronavirus coverage. On the site information about the number of people infected with COVID-19 in Colombia is categorized by gender, age and region. The site also details the type of care the COVID-19 patients are receiving: at home, in the hospital, in intensive care, recovered or deceased.
Costa Rica
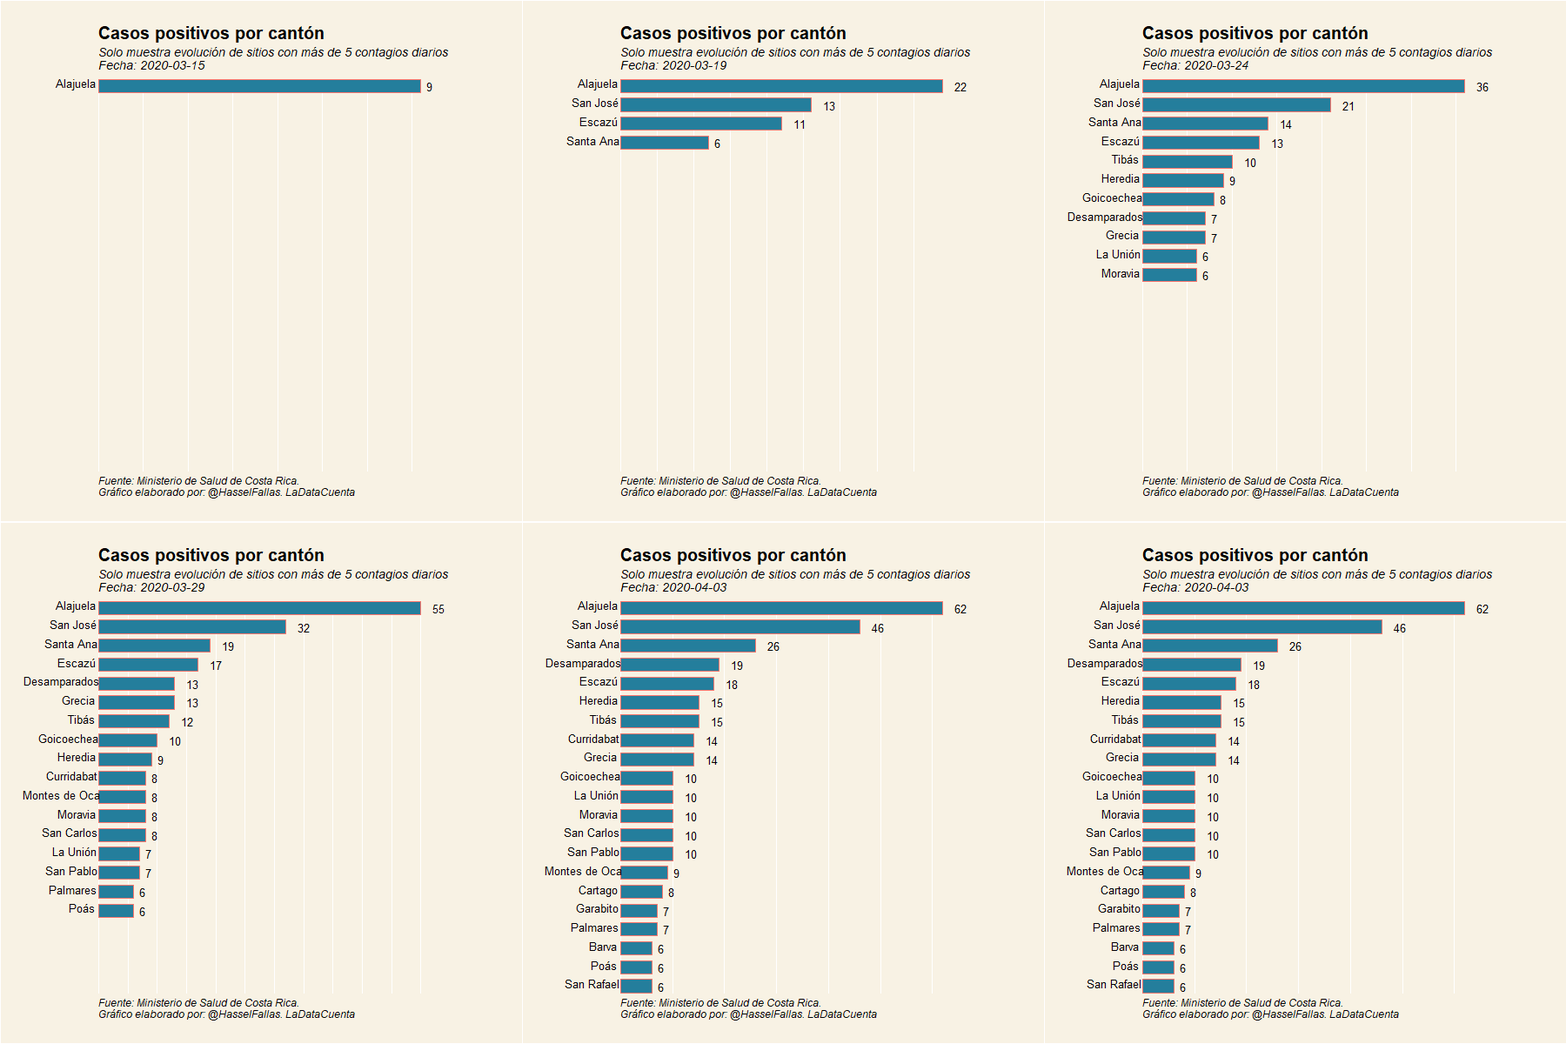
Data journalist Hässel Fallas created her own website to monitor Costa Rican, Latin American and worldwide COVID-19 developments. The site features the number of COVID-19 tests administered daily in Costa Rica, the number of people infected in each of Costa Rica’s districts, the gender of the people infected and the evolution of infection in the country over time. The site also includes a graphic depicting the age range of the people infected, which shows that just 6% of infected Costa Ricans are elderly. The site also features graphs of the number of COVID-19 cases in other countries around the world. These statistics and graphs are updated on a weekly basis.
If you are interested in exploring other Latin American data journalism projects related to the pandemic, you can check out the archive of projects featured in this April 2 webinar recording organized by SocialTic.
Main image CC-licensed by Unsplash via Isaac Quesada.

