The line for coffee is always a good place for conversation, especially at the annual Mozilla Festival on the future of the web.
Last year, while waiting for caffeine, I ran into Aron Pilhofer, interactive news editor at the New York Times. Pilhofer said the team was growing at a rapid pace. "What type of developers are you looking for?" I asked. "A D3 guy," he said without hesitation.
Pilhofer was referring to D3.js, the JavaScript library Data-Driven Documents, a powerful tool for creating complex visuals and interactive designs. The website Data-Driven Journalism describes D3.js as “a magical chunk of JavaScript code that helps you express data visually on the web….it connects data values to document elements, thereby ‘driving’ the document from data.”
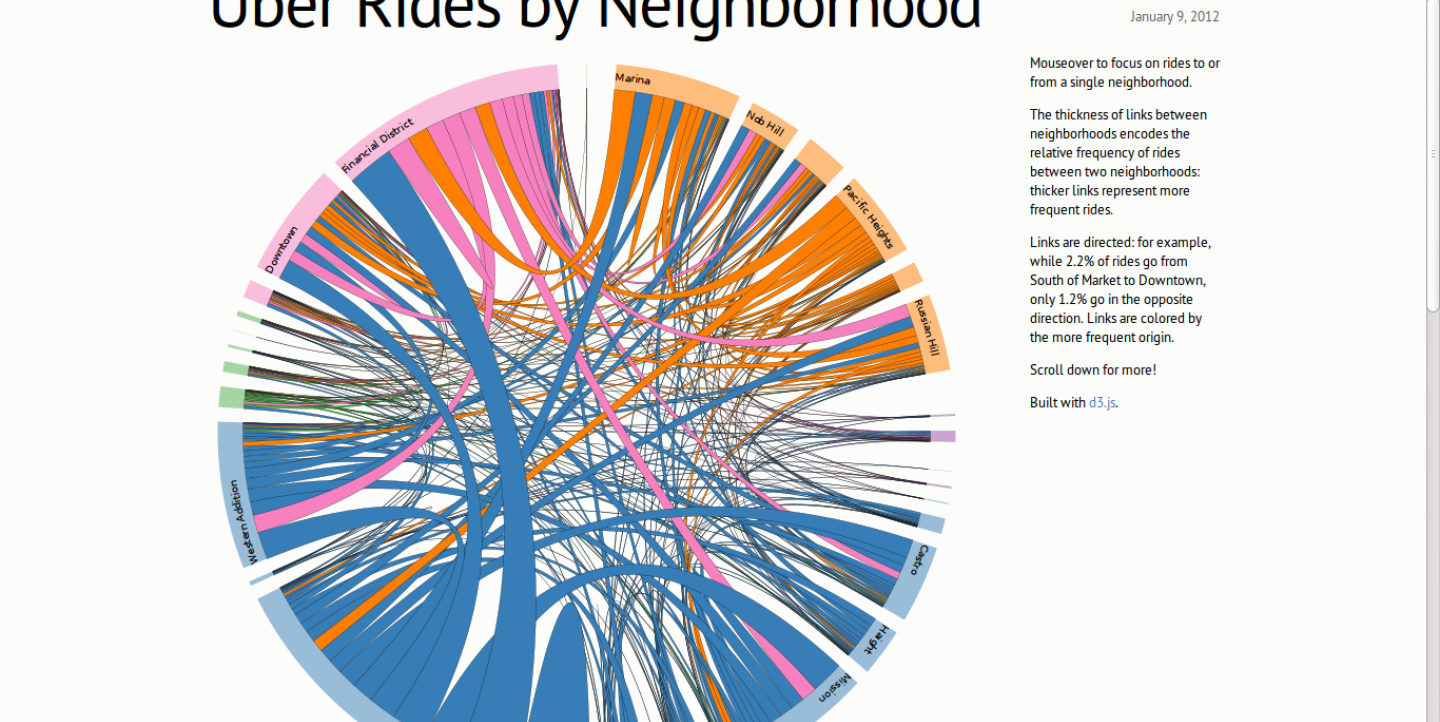
Mike Bostock, who at the time also worked for The New York Times, created D3.js. He used it to create groundbreaking interactive graphics such as Paths to the White House.
The library is expanding the boundaries of data visualizations for storytelling. Just browse Bostock's website or check out the D3js.org gallery of examples to understand the potential it has to visualize stories. The size of China's manufacturing industry, the increased surveillance forces on the border between the U.S. and Mexico, or the connections between Oscar contenders, are just a few examples of what can be displayed better with D3.js.
Essentially, the library allows you to manipulate data-based documents using open web standards and browsers. This means we can create complex visualizations without relying on proprietary software. It is a clear replacement of Flash, with the stark difference that all developments are open and can be re-used by other developers. Its potential is as vast as geometry itself. You can create bubbles, Chord diagrams, tree maps, node links and dozens of other complex visualizations.
In our Hacks/Hackers Buenos Aires group, we detected the growing interest of developers and journalists for using D3.js for their stories. At the same time, we notice a lack of a critical mass of knowledgeable programmers, and even more so, the lack of its use by mass media in the region.
Why is such a powerful tool still so little-used? Is it a question of inertia, or the limited presence of data journalism teams in traditional media?
How can we figure out where we are stuck? With a hackathon. Hacks/Hackers Buenos Aires will hold an April 20 meet-up on D3.js, sponsored by ICFJ and Open News. More than 100 participants have already confirmed their attendance. We hope to gather a handful of data sets, provided by the site Chequeado.com and bring together developers and media outlets and stimulate further investigation on the possibilities that exist.
With a little luck, some of the prototypes we develop in the hackathon will be completed soon. And who knows? Maybe one of the participants will even become a "D3 guy.”
Knight International Journalism Fellow Mariano Blejman is an editor and media entrepreneur specializing in data-driven journalism.
This post was translated from Spanish into English by Nathalie Cornet.
Image: screen grab from Mike Bostock's blog.

