
Visualizing a complicated set of facts — and understanding the context — can be tough.
Try, for example, picturing this: Ramallah, Palestine has a higher annual rainfall than London. Yet each Palestinian in the West Bank is only allowed to use 70 liters of water per day compared to the World Health Organization’s recommendation of 100 liters.
Visualizing Impact (VI), a socially driven data and design company based in Beirut, Lebanon, is trying to make facts like Palestine’s water shortage more digestible, accessible and shareable. To illustrate the Palestinian water limitations and other social justice issues, VI’s team of designers, web developers and data analysts create infographics to share with as many people as possible.
“We make socially aware products,” Fadi Shayya, a VI adviser and process strategist, told IJNet. “When we produce these different outputs, the idea is to share them."
Below, IJNet takes a look at how VI disseminates its material, the history of the organization and what's in the works.
What are VI’s roots?
Before VI existed, Visualizing Palestine (VP) made a splash in 2012 when it released a graphic explaining what a human body goes through over the course of a hunger strike.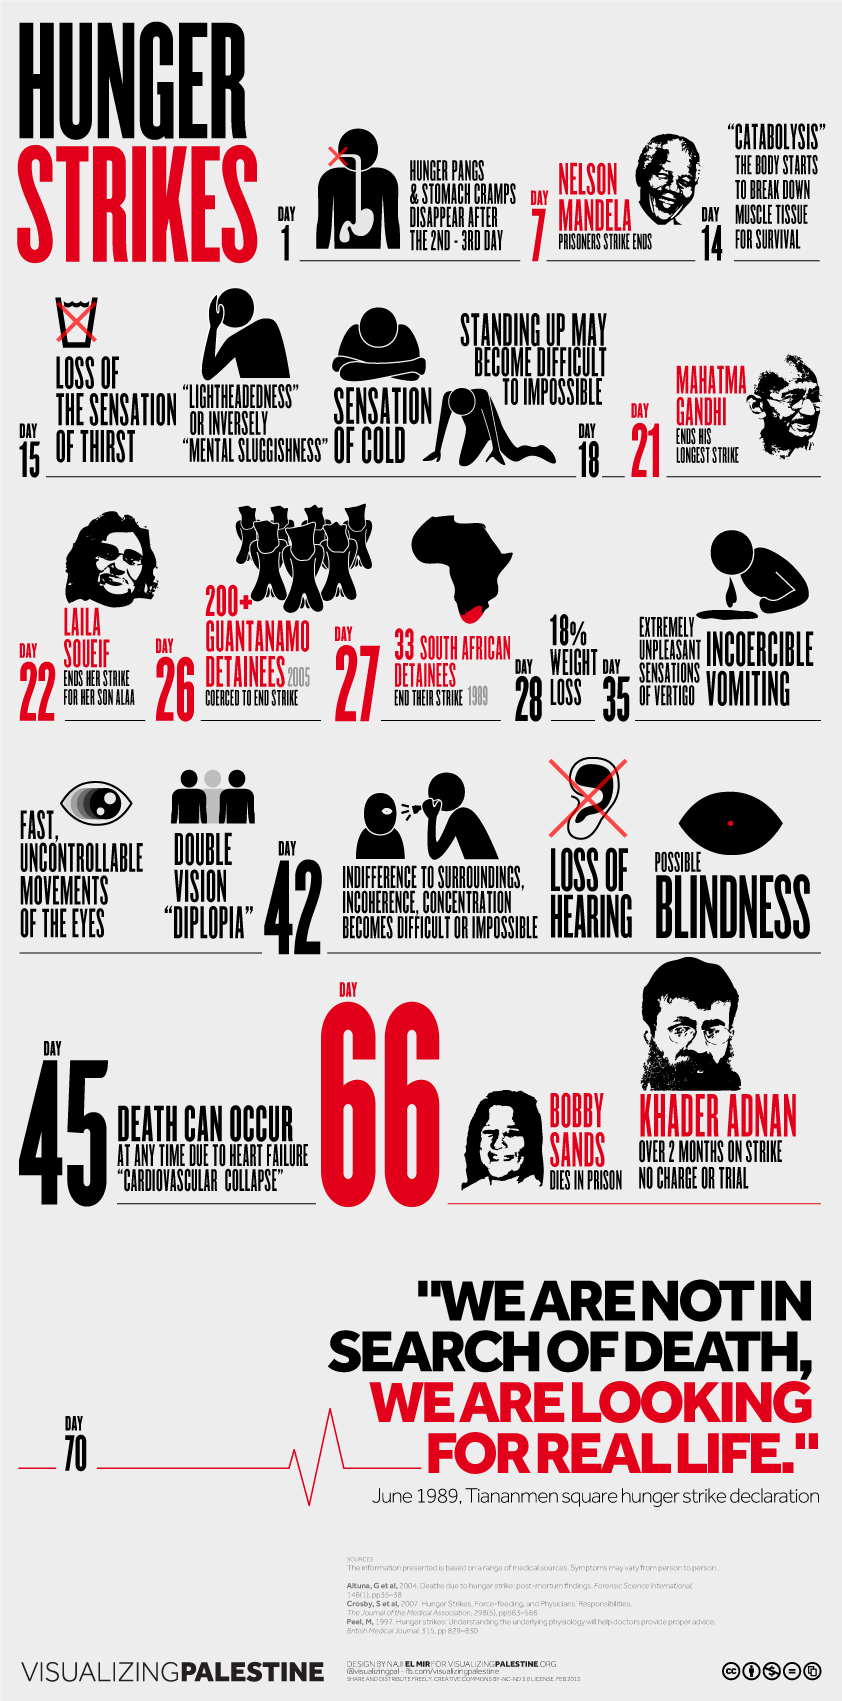
The graphic represented Palestinian Khader Adnan’s 66-day hunger strike, which he endured after being held by the Israeli prison service on the grounds of administrative detention, the state's arrest of an individual without trial. (Click here for a larger version of the graphic.)
The Israeli government often uses administrative detention to imprison Palestinians. VP co-founders Joumana al Jabri and Ramzi Jaber started their organization to design fact-based graphics to push for social justice. Illustrators and graphic designers use data from a range of sources to highlight aspects of the Israeli-Palestinian conflict.
VI began as an umbrella organization to encapsulate VP and other future spin-offs. Visualizing Egypt is in the works, and Shayya says VI’s main goal is to access as many people as possible. Potential VI themes could be geographical, but they could also be based on topics like technology and politics.
Who uses VI’s visuals?
Anyone can share VI’s visuals using the Creative Commons license, and news organizations such as Al Jazeera, The Guardian and The Huffington Post have used its content. VI also sells physical prints of its visuals online.
Where does VI find the data?
Each VI infographic contains a slew of numbers and facts. The designer cites sources in fine print directly on the visual and offers links on its site to where the VI team found the data.
A team of full-time researchers work with web developers and designers to illustrate facts correctly and use methods such as data mining and web scraping to extract information.
Sources vary depending on the visual's concept but include news outlets, reports from nonprofit research institutes like the Urban Land Institute, the United Nations and the World Health Organization.
What's VI's business model?
The co-founders initially funded VP, a registered nonprofit in Palestine, through a crowdfunding campaign. During one month in late 2013, 403 people donated approximately US$70,000. Aside from individual donors, VP is also funded through grants from various organizations, including the Arab Fund for Arts and Culture and International Media Support.
VI is a registered company in Lebanon, where its main offices are located. VI makes money from commissioned design collaborations and selling those physical prints.
“We wouldn’t have been able to do this without grants, individuals, companies or through our line of products,” Shayya said.
What’s coming up?
VI produces most of its work in English and Arabic but would like to broaden its audience by translating visualizations into other languages.
VI staff and volunteers have already translated some graphics into 11 other languages, including Spanish, French, Chinese and Korean.
People interested in donating time to VI can sign up to volunteer through its website, but once they express interest, their names and skills live in spreadsheets. If VI needs something translated, someone combs through the list of volunteers to see who is proficient in that language.
To streamline the process, the VI team is developing a crowdsourced translation platform. It will be open to anyone interested in translating VI’s work, and there will be peer-to-peer editing to make sure the translations are thorough.
Main image CC-licensed by Flickr via Susan Murtaugh. Secondary infographic courtesy of Visualizing Palestine.