
This week, we spoke with Peruvian investigative journalist Fabiola Torres, who will be one of the speakers at the upcoming Global Investigative Journalism Conference. As an ICFJ Knight Fellow, she recently launched Salud con Lupa (Health under the Magnifying Glass), a cross-border network that investigates health issues across Latin America. The project aims to fight rampant misinformation on health-related matters by focusing on data-driven stories, as well as to expose failures by states and abuses of power by private entities.
In the first series for Salud con Lupa, Torres worked with journalists from Chile, Colombia, and Mexico to reveal how food and pharmaceutical companies have influenced Latin American governments, notably through a revolving door of executives who move between corporate positions and key posts at state health agencies.
Torres has long focused on health reporting. She was one of the founders of OjoPúblico, a nonprofit newsroom in Lima; there, she spearheaded The Big Pharma Project, a series of multinational investigations that shed light on the methods used by pharmaceutical companies to consolidate their monopolies in Latin America.
A member of the International Consortium of Investigative Journalists (ICIJ), Torres also worked on its Implant Files, analyzing how defective medical devices made their way to Peru.
Here’s what she had to say about some of her current favorite tools:
OpenRefine
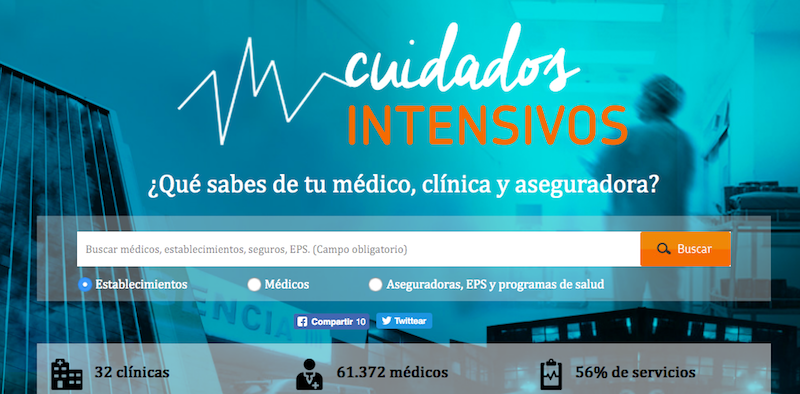
I use OpenRefine to clean and organize all of my data. It’s my very first step when working with data. For example, I used it to clean the data for OjoPúblico’s Cuidados Intensivos project, where we created a tool that allowed readers to see which medical professionals and clinics had paid fines or been prosecuted for malpractice. At first, when we looked at the data, we found that names of companies were often written in different ways and with different spellings, so OpenRefine allowed us to clean that up. We also used it to match code names or numbers, which showed us that some companies were in fact one and the same.
Datawrapper
Datawrapper is a simple tool to create visualizations. You can create all sorts of charts as well as maps. These are embeddable, so they are responsive and look good online. You can choose fonts and colors that match your website’s design. And, importantly, it’s capable of handling a large amount of data.
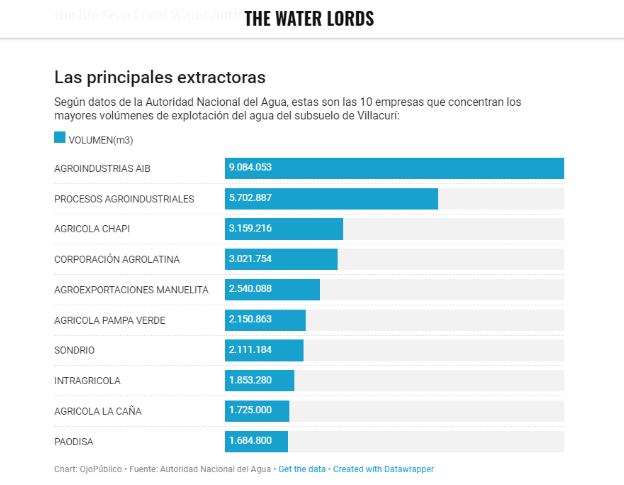
I used Datawrapper to create visualizations when I was working on The Water Lords investigation. I visualized the group of agro-exporters that exhausted water supplies in the subsoil of the Ica region in southern Peru through illegal wells, extraordinary regulations, and obstruction of the work of state inspectors. To identify illegal wells, my team flew a drone above Villacurí, home to one of the world’s major asparagus-producing regions, where a water shortage is forecast and where almost half of all drilling is informal.
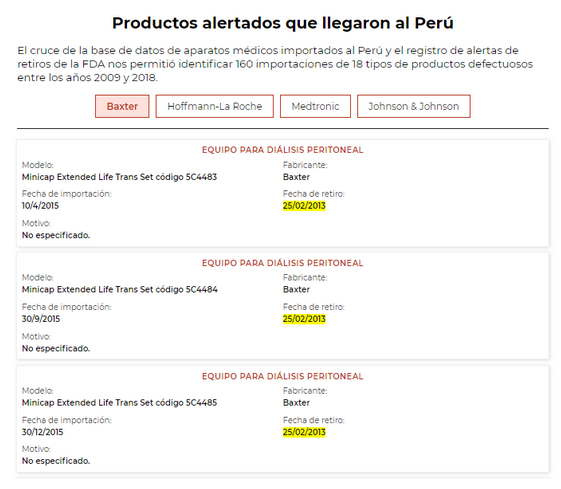
I also used Datawrapper to create visualizations for the Implant Files stories on Peru. Using data from the FDA [Food and Drug Administration], from the Datasur service [see more on Datasur below], and from local register Digemid, we followed defective medical devices from the United States to Peru. We identified a group of medical devices recalled in the United States that were imported to our country despite the alert. We then visualized the data so that our readers could see what types of devices had reached Peru and which companies had built them, and we also ranked the companies to show which ones had exported the most defective devices.
We prepared visualizations in Datawrapper, and then our programmer helped us to create a more sophisticated version.
Linkurious
I first used Linkurious for the Panama Papers investigation, when ICIJ provided a login to our team at OjoPúblico. It’s a very powerful tool that allows you to investigate links between different entities. ICIJ had built a huge database of documents related to the Panama Papers, and with Linkurious, we could then search for a company and it would show us a big graph of all of the company’s relationships. We could click and click and click and discover all sorts of connections. When you have a lot of information about companies — documents, emails, photographs — it can be very difficult to sort through it all, but with Linkurious, we could see it all in one place and navigate it easily.
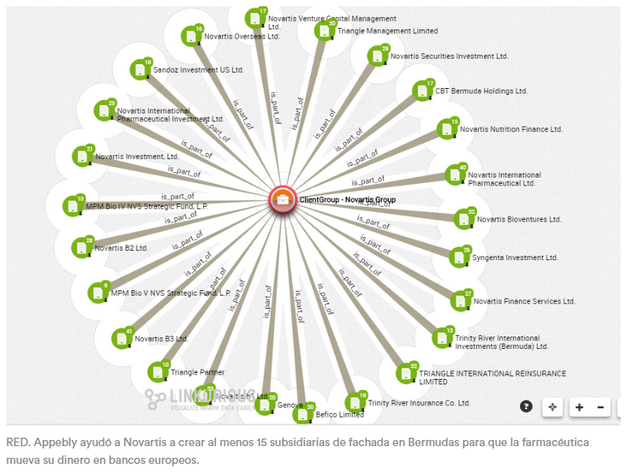
We also used Linkurious for the Paradise Papers. It helped us discover that the pharmaceutical company Novartis had many more subsidiaries than we thought at first.
MedsPaL
MedsPaL stands for the Medicine Patents and Licenses database. It’s a platform that shares information on the patent and licensing status of life-saving medicines in developing and transitioning countries, for example HIV and hepatitis C medicines.
When I was working on The Big Pharma Project, we used MedsPaL to look at the licenses for HIV medicines in different countries. In Peru, there’s a drug called Atazanavir that has a monopoly, and there was a debate about whether the government should use a regulatory mechanism to break this drug’s patent. We were able to compare our situation with those of other countries that broke the patent, like Chile and Bolivia. HIV treatment now costs less in these countries.

DIME
Access to affordable medicine is a huge problem in Latin America. To investigate this issue, I recommend DIME, a platform that tracks the cost of medicines in eight Latin American countries. It allows you to find all sorts of information, like how much of a drug a country is buying, at what price the state is buying it from the company, minimum and maximum prices, the status of licenses, etc.
For The Big Pharma Project, DIME helped us calculate the cost of different courses of treatments for a person who doesn’t have health insurance.
Datasur
Datasur is a paying service that gives you information about the imports and exports of Latin American countries, which you can download in an Excel format. This was very useful when we were tracking the imports of medical devices to Peru for the Implant Files. We were able to find all the information we needed, including which company built the device, what year it was imported into our country, and which company served as an intermediary. Currently, with my colleagues at Salud con Lupa, we are using Datasur to investigate Venezuela’s importation of medicines and to find out who is profiting the most during the country’s humanitarian crisis.
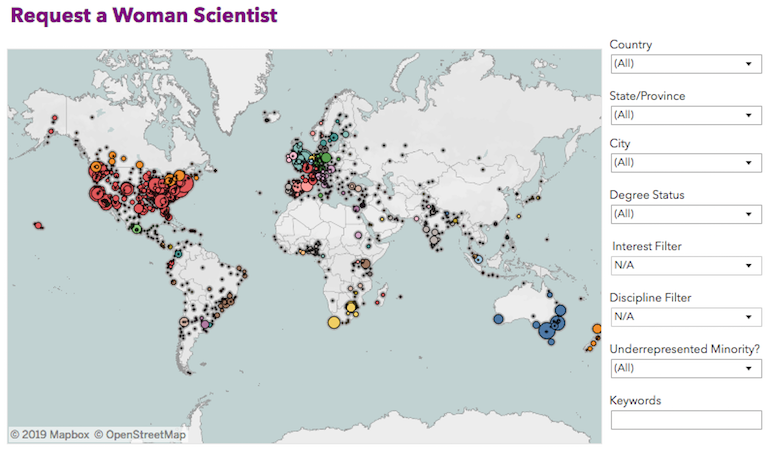
Request a Woman Scientist
This tool is just what it sounds like. At Salud con Lupa, we often need to verify information on medical topics, so we look for experts with the most specific knowledge possible, wherever they might be in the world. On this platform, you can search by country, discipline, interest, and degree.
This article was originally published by the Global Investigative Journalism Network. It was republished on IJNet with permission.
Gaelle Faure is GIJN’s associate editor. Previously, she worked for France 24, where she specialized in social news gathering and verification. She has also worked as an editor for News Deeply and reported for Time Magazine.
Fabiola Torres is an ICFJ Knight Fellow based in Lima, Peru.
Main image CC-licensed by Unsplash via Christopher Gower.