The year 2020 wasn’t just dominated by the pandemic. It was also a year of open data.
Many health-related organizations published daily and real-time updates about the spread of the virus around the world, circulating an unprecedented amount of numbers and figures. The challenge for journalists has been to analyze this information accurately, and communicate their findings to the public effectively.
It’s imperative that journalists first understand the data they’re working with. While there is often a rush to publish in today’s non-stop news cycle, doing so inaccurately does more harm than good. During a crisis like COVID-19, data can help raise critical awareness among the public. But if mishandled, it can place people at greater risk.
Always analyze numbers with healthy skepticism. As journalists, we should investigate when and from where the data we use originates. We should determine who originally collected and published the numbers, as well as the funders behind it.
Journalists must also fix illogical or missing values, and clean up mislabeled figures. These errors may occur during the data entry process, whether done manually or automatically.
[Read more: How to avoid common data visualization errors]
The Jordanian Ministry of Health, for example, used to manually enter some COVID-19 test results that didn’t automatically get uploaded into the government database. As the number of daily cases increased, results were lost, and mistakes related to the names and their samples were made, former Jordanian Health Minister Saad Jaber told local media.
Keep in mind, too: even when using reliable software like Microsoft Excel, human error can sneak through. Take, for instance, this incident that occurred in the U.K. last year: 16,000 records of COVID-19 patients were accidentally deleted from an official database, resulting in the spread of inaccurate data which hindered efforts like contact tracing to combat the virus.
To avoid publishing inaccurate data, rely on credible sources and verify the numbers. Here’s a checklist to help:
Transparency
Seek out resources that are transparent about how they compile and document data. This includes the technology and algorithms they used during the process. The more transparent data providers are, the more potential for accuracy there is.
To this end, make sure you understand how data is being collected by the source you’re referencing. This will enable you to best analyze and verify numbers before you include them in your own reporting.
[Read more: Health reporting: Finding data and verifying expert claims]
Methodology
Don’t publish a dataset without attaching the corresponding metadata file, which helps explain how the data was collected. It can also include information about sample size, error margin and missing values, and it includes a glossary of terms and abbreviations. Without these details, you’re like a person who has discovered a gold treasure chest, but doesn’t have the keys to open it.
In Italy, for example, journalists questioned the credibility of official government data around COVID-19 after finding flaws in the numbers presented to the public. This can be attributed to a variety of factors, among them that the government changed their testing policies several times in 2020, and that methodologies to track cases of the virus differed by region. This contributed to inconsistent, deficient data overall. Had a metadata file been made available, these errors could have been more easily identified.
Context
Context is key when analyzing data. For example, consider how you present information about total infections and infection rates. When a government authority presents regional data about the number of people infected with COVID-19, a large city might show the highest value. This doesn’t necessarily mean its infection rates are highest, however — it might simply be the result of being the most populated area.
The more appropriate way to compare numbers in locations with different populations is to calculate infection rates per 100 people. This will more accurately demonstrate the spread of the virus.
Understand the data
Don’t start working on a database unless you understand what is being presented. To do so, ask yourself the following questions:
- What does the data indicate?
- Do I understand all terms and definitions included in the data?
- What is not included in the data that could provide context?
- What are the units of measurement?
- Can you cross-reference the data with a different source, to corroborate the values?
Verifying data requires investigation and analysis. Fortunately, journalists don’t need to be data analysis experts to carry this out. Journalistic values, skills and instinct are all effective methods to assist with fact-checking numbers. Manual verification can be even more effective than automated verification algorithms. While technology might not always be able to determine the credibility of data, it can provide journalists with useful tools and guidance to help.
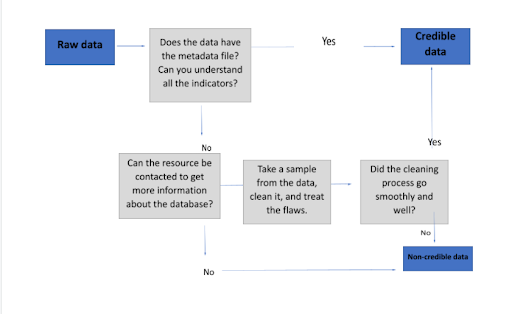
At all turns ask questions, be skeptical, and review and cross-reference your numbers as much as possible. The following diagram shows the steps I follow when dealing with numbers in a database. It might help you build your own verification strategy.

Photo by Mick Haupt on Unsplash.


