
Last year, InfoAmazonia launched a new website that began tracking environmental threats to the Amazon region, such as deforestation and wildfires, and displaying them in maps. Now, we're taking it to the next level by using interactive photo galleries and video mashups as a unique storytelling tool.
In addition, we are adding functionality to the site with the “distribution widget,” which will allow journalists and NGOs to customize their own maps and data layers.
The InfoAmazonia platform uses satellite feeds and other publicly available data to monitor the fragile, nine-country Amazon Basin region. The platform was launched last year as part of my Knight International Journalism Fellowship in partnership with Internews and O Eco.
We are making changes to InfoAmazonia on both the front and back end of the platform. Our team worked with two studios in São Paulo, Memelab and Cardume, whose developers were trained by MapBox/Development Seed, the company that built our original platform.
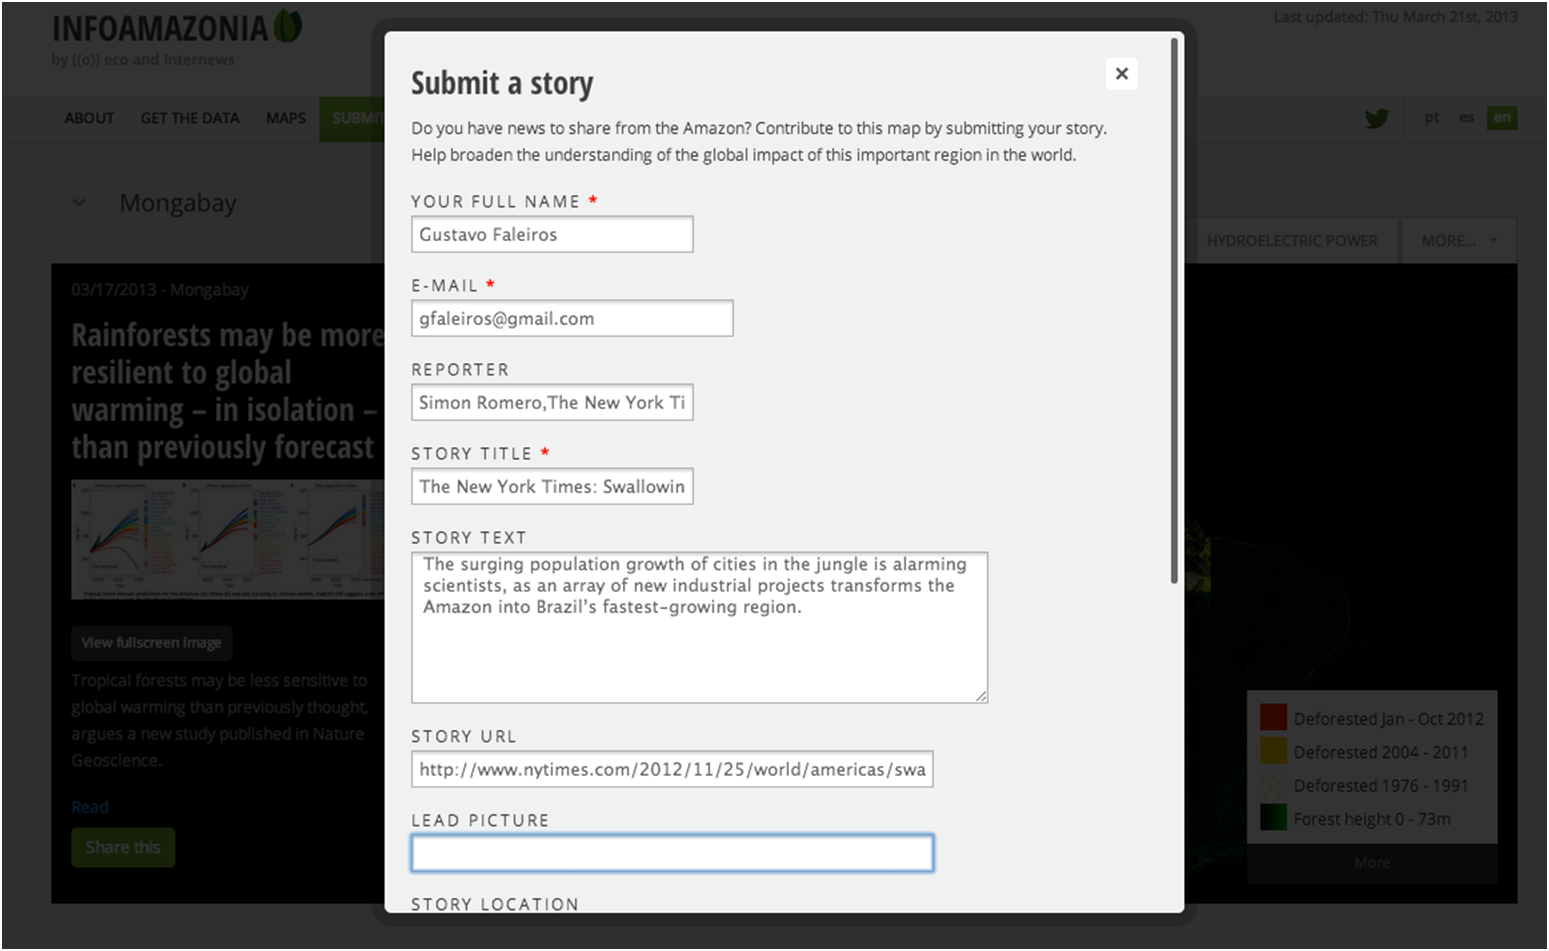
The news aggregator of InfoAmazonia now works on an open source WordPress theme developed specifically for using the MapBox API and allowing journalists and the public to post and geolocate stories directly on our Amazon maps.
Originally, InfoAmazonia was a CMS free application and its dataset of news stories was a simple Google Spreadsheet. As we now see our database increasing – 630 stories already aggregated - we thought it would be easier to adapt to an existing CMS. The decision of migrating to WordPress was not easy, but it was based on the perception that journalists are the main professionals updating InfoAmazonia and we should make this work as simple as possible.
Here is our submission box for stories on InfoAmazonia.org:
Now it is also possible to find any story in our database of around 630 news pieces aggregated in the last nine months. The stories can be filtered by date, publisher and specific maps.
We also added location search to all of our maps. A “layer switcher,” which lets users toggle between viewing protected areas and indigenous land, is now available as well.
One of the most important new features of InfoAmazonia is a maps page. The idea is that journalists and contributors will be producing many more maps, keeping pace with the news. The InfoAmazonia CMS allows integration with the data layers hosted by MapBox and the maps are now highlighted according to the demand.
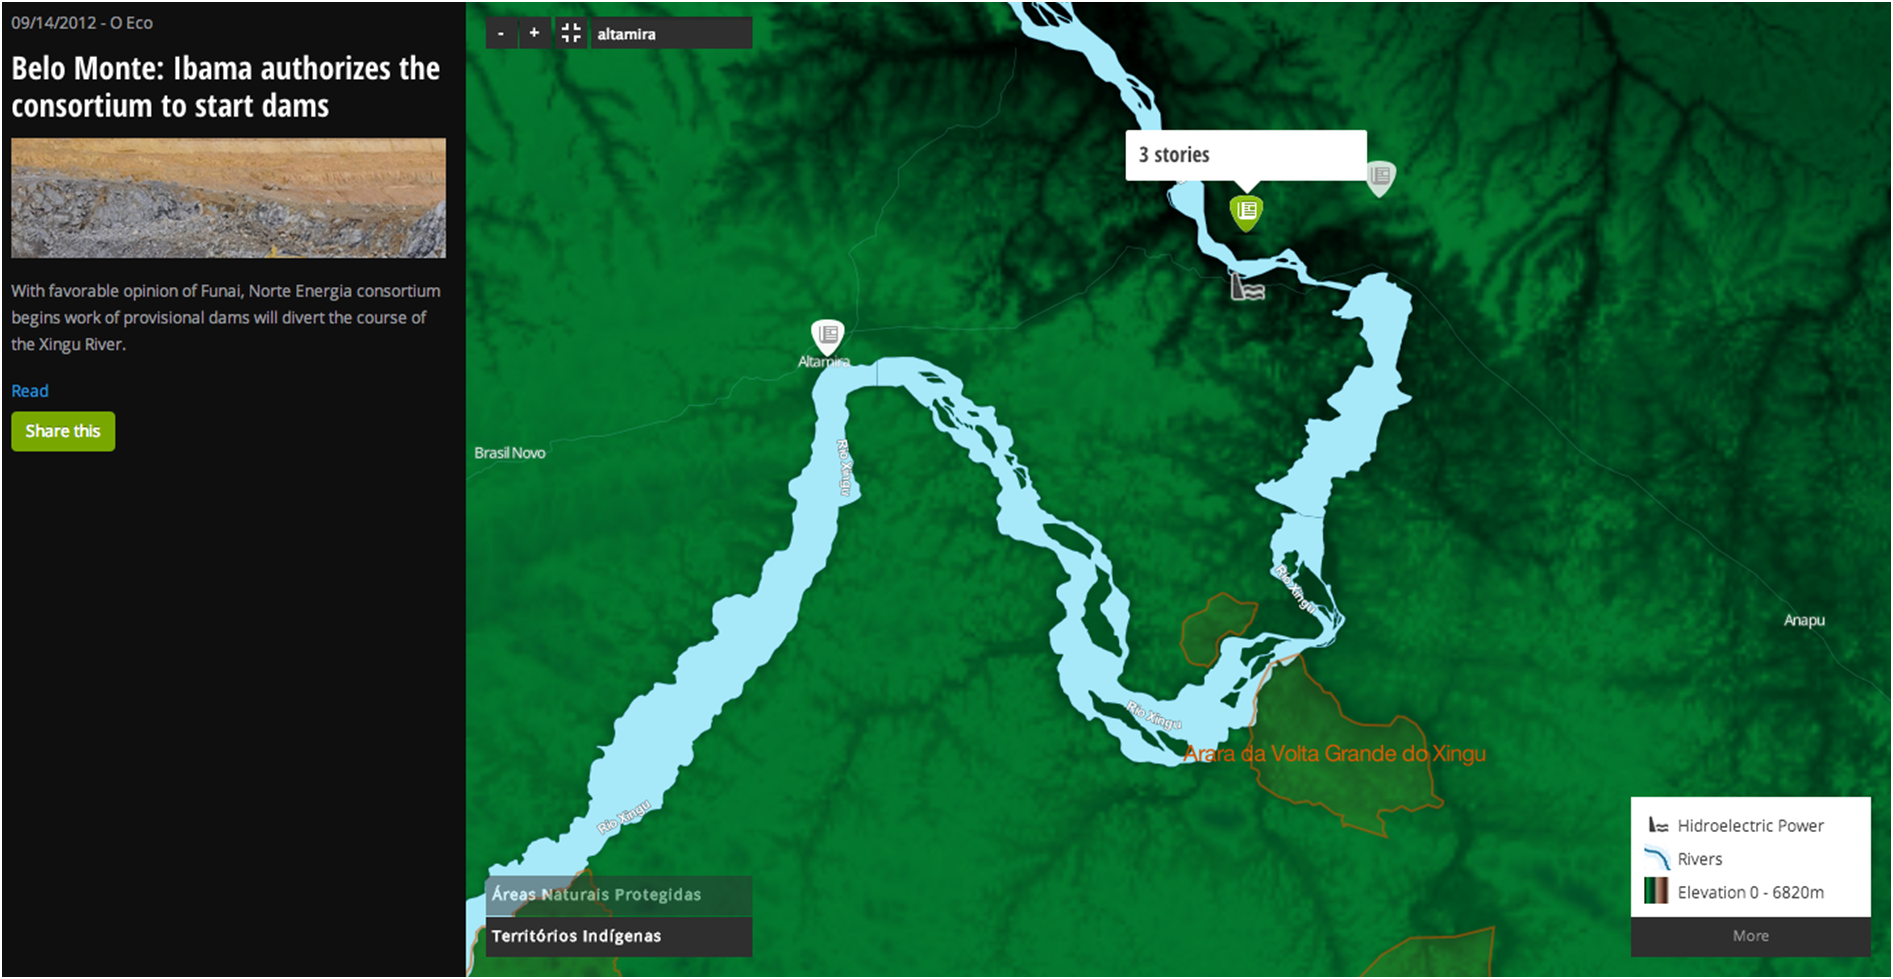
This photo features the Belo Monte Dam map, with a search option on the top left and a layer switcher on the bottom.
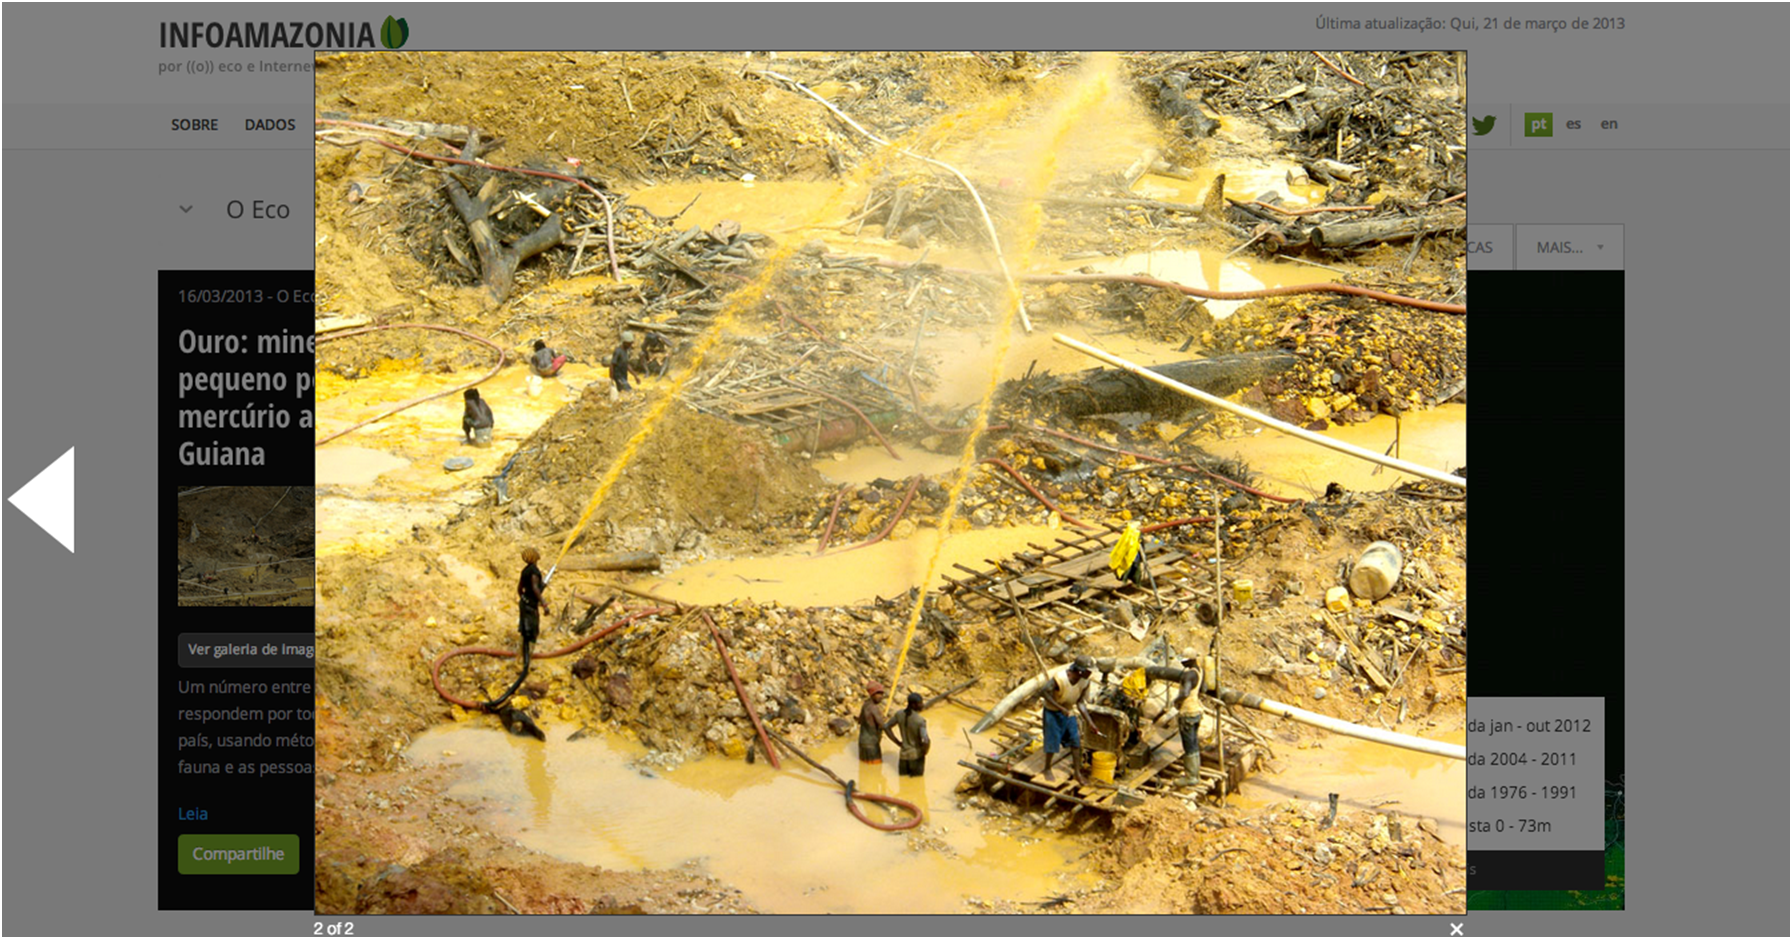
All the pictures and videos are now being shown as galleries of images and videos mashed up with the maps.
Next up: The distribution widget
In addition to the changes we’ve already made, we will soon launch the distribution widget, a toolbox that will allow users to create customized embedding codes for our maps. Again, we’ve turned to MapBox for the design of this new frontier on our project.
In São Paulo, Memelab and Cardume are working to create news feeds, using RSS and APIs (geojson) to make it easier for people to sign up and follow specific topics of Amazon news, such as deforestation, biodiversity, water and protected areas.
Investing in distribution seems to be the way to go with InfoAmazonia, as we are collecting large amounts of data. Soon, the aggregated stories will themselves make up a large dataset. We are looking for partnerships with media, NGOs, think-tanks and others we believe can benefit from using the data and maps of InfoAmazonia.
Last year, Agência Pública, an investigative journalism agency based in Brazil, has partnered with us to create their interactive pages. O Eco, the original media house hosting InfoAmazonia, has used deforestation data for highlighting issues that were hidden before.
Gustavo Faleiros is an environmental journalist and media trainer who specializes in data journalism. He is a Knight International Journalism Fellow based in Brazil. You can follow him on Twitter.
Images courtesy of InfoAmazonia.