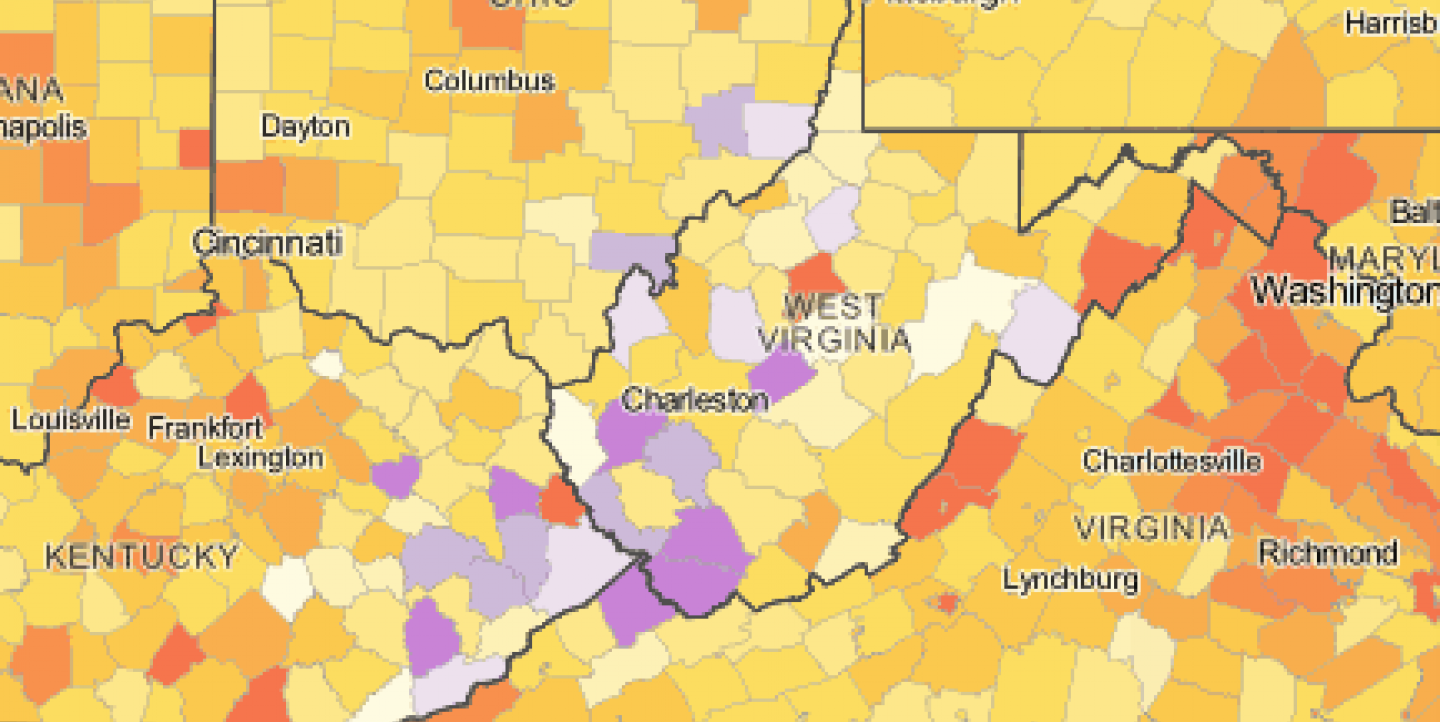
Just 10 years ago, creating an interactive online map was complicated, if not impossible, for most Web users. Now, journalists can design attractive maps in the cloud and publish them in minutes.
In recent years, the news industry has started taking advantage of exciting opportunities for Web-based maps beyond Google. The two-year-old company MapBox is an important driver of this development.
A product of the Washington-based company Development Seed, MapBox gives newsrooms and bloggers the ability to control how maps look and what data appears on these maps. MapBox has been used create maps on topics from Census data to fire forecasting to "the dogs of New York."
In September, the John S. and James L. Knight Foundation awarded MapBox a $575,000 grant to improve the core infrastructure of OpenStreetMap, a free, crowdsourced world map created by volunteers.
Last year, MapBox helped launch InfoAmazonia, which brings news and environmental maps from the nine-country Amazon region. Developed by Knight International Journalism Fellow Gustavo Faleiros, InfoAmazonia's maps cover issues ranging from deforestation to extractive industries to indigenous issues. It also provided training to the journalists who would be powering the site.
To learn more about MapBox and the future of maps in journalism, IJNet spoke with Alex Barth, senior developer at Development Seed:
IJNet: An array of journalists and media organizations are using MapBox. What are some of your favorite examples of how the tool is being used in journalism and why?
Alex Barth: Here are some examples I love:
- NPR Census map, a long-time favorite, shows nicely how you can use TileMill + MapBox hosting for creating really fast maps with tons of data (300MB of U.S. Census data here!)
- NPR Fire forecast
- USA Today live election maps are great examples of mixing vector maps with tile maps [those that feature custom data]
- Incredible high-data density on this global warming map
- Creating a ZIP code area-based map like this one here can be fairly straightforward
- Changes in property taxes in Philadelphia – [This offers] great density and detail of data--you can find your lot!
- InfoAmazonia is publishing news and more than a dozen contextual data sets from the Amazon
IJNet: What skills and/or knowledge does a journalist or media organization need in order to tell a geo-story with MapBox?
AB: Building a map with MapBox can be as simple as placing markers and sharing the result, either with a link to your map on MapBox or by embedding that map like a YouTube video, for instance in your blog. To take a step up, you can use an OpenStreetMap-based MapBox map of the world or our Satellite layer and build a light custom news app using MapBox.js. There are some great examples and templates to give you a sense of what's possible. You can of course also choose to go all-out and create tile-based map layers yourself. Here you would use TileMill, render map tiles yourself and upload them to MapBox. You'll want to do this if you want absolute control over your cartography or you have really detailed data like in the case of the NPR census map. On the lower end of this spectrum you don't need any special skills.
Climbing up the map-making curve you'll want to have light Web programming skills. If you'd like to create your own maps from scratch, solid data processing skills and basic knowledge of cartography comes in handy.
We provide continuously updated, detailed help on mapbox.com/help and we're happy to work with journalists on specific mapping projects. Over here at MapBox, we are really excited about the transformation in journalism happening right now, the speed with which interactive features--and thus online maps--are being embraced and the level of quality we're seeing from teams like the New York Times, NPR, ProPublica, or the Washington Post.
IJNet: What do you see as the future possibilities for journalists and MapBox? Is the market for news mapping expanding?
AB: The way we look at maps and how maps are used in the news is changing really fast as we speak. Maps are an incredibly central to news--almost like pictures, and that's not new. What has been odd, however, is that over the last couple of years there has been seemingly only one way to do maps online. And this is changing fast…. MapBox gives you the ability to control how maps look and what data shows on these maps. We can give your newsroom the tools it needs to really own maps just like it owns its paper or its website; you shouldn't expect anything less. Especially since we're able to offer customizable world maps based on OpenStreetMap and Satellite maps we're seeing exciting additional uptake that we expect to continue.
Image: NPR's U.S. Census Map, courtesy of MapBox.

