In April 2013, Hacks/Hackers Buenos Aires hosted a hackathon on D3.js. As part of a project co-sponsored by the International Center for Journalists, Knight-Mozilla OpenNews provided seed funding to the winning project, an app called “Década votada" (A decade in votes).
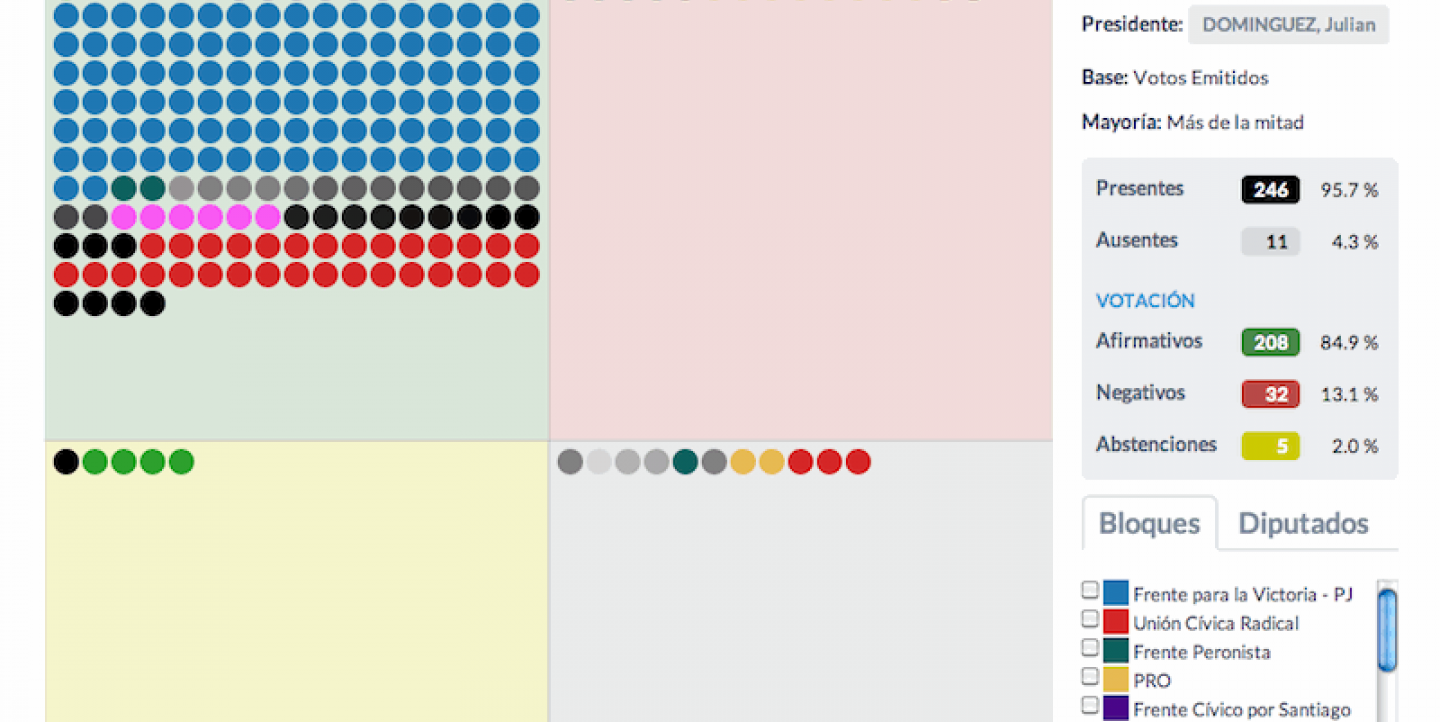
The winning team came up with the idea of building a visualization news app that would help people understand Argentina’s National Congress elections and the degree of each candidate’s allegiance to their party at the moment of voting. The application is available here and was built by Andy Tow, Gonzalo Bellver, Luciano Amor and Martín Szyszlican with the collaboration of Teresa Alberto Mariela Duarte, Sonia Jalfin, Amalín Ramos, Olivia Sohr, Agustín Telado and Thalis Kalfigkopoulos.
The code is available on GitHub and the data visualized using Google Fusion Tables is available on Andy Tow’s site. I interviewed the team to understand the project and the goal behind it.
How did you come up with the idea?
Andy Tow brought to the hackathon a dataset with the roll-call votes from 2003 to 2013 from Argentina’s National Congress. Watching other visualizations that allowed users to group and regroup individuals with different attributes, we realized we could show the positions of legislators in each vote as a “game” in which the winner was the one who was able to add more people to his pie slice. We were inspired by a few parliamentary voting-systems and the US primary election caucuses in which each participant shows his position by physically positioning himself on one side of the room.
As additional background, another team member, Martín Szyszlican, had been working (along with Teresa Alberto and Alfredo Ramirez) on visualizing congressional information from 2009 with a group of interactive designers who were studying data visualization, interactive design and usability. This group started Interactive Congress and we have been working on it since, which made it easy for us to work as a team at the hackathon.
What problem is the app trying to solve?
Readers need to be informed about the roll-call votes so they can understand the news they read. At the same time, journalists need to understand the whole political panorama. But without our tool, they will be stuck reading PDFs, which would take weeks. The official records of congress elections show what is displayed in the news app but not in a very user-friendly way: it shows a number or profile for the vote being held (similar to an ID for the vote), a list of legislators for each vote held, a list of voting blocs, and a list of the votes by bloc.
We wanted to have a general snapshot of every vote to compare and visualize elections. Using colors to identify each political bloc, we were able to see how legislators were regrouped for various votes and understand the composition of Congress and which bloc approved or rejected each issue. By identifying individual legislators it’s possible to see how often they vote according to their party’s agenda.
We believe that we’ve solved the problem in a simple way that allows an easy querying of the role of blocs and legislators through time.
How did you get the data?
Nominal voting records are stored as PDFs on an official government website. We did some scraping and data mining and then converted 1,300 records into a relational database with four tables: issues, congressmembers, blocs and votes.
How did you build the app?
For the original prototype, we used a local database in .tsv. Then we adapted the queries to Google Fusion Tables and developed a proper client. We used D3.js for vector graphics to create, move and locate individual circles in each vote. Angular.js and Bootstrap styles were also essential for the interface, which allows the user to filter by year, date and issue.
Can the project be replicated?
It’s possible to adapt the roll-call vote app for other legislative bodies using the present database design: the app is specifically designed for representatives chosen by district and regrouped by political bloc, but these attributes can be replaced with a different set of attributes corresponding to other congressional models. It’s also possible to modify the parameters of quadrants or individuals, customize colors, etc.
Next steps
We need to build a search function. The archive is available here. Also, the Congreso Interactivo (Interactive Congress) team is building automatic scrapers for this same kind of data based on the work developed by Manuel Aristarán.
Mariano Blejman is an editor and media entrepreneur specializing in data-driven journalism. Read about his Knight Fellowship here.
This article was cross-posted from Source, a Knight-Mozilla OpenNews project.
Image courtesy of Mariano Blejman.

