
Much of the infrastructure for effective watchdog investigations — from global datasets to cutting-edge open source tools — has already been built, and journalists everywhere were invited to use those techniques to dig further at the 12th Global Investigative Journalism Conference (#GIJC21).
In a “lightning round” session at #GIJC21, a panel of reporters and editors needed just five minutes each to outline new ideas for what journalists can do to gather hard-to-find facts.
Here are some of their suggestions:
Facial Recognition
Consider facial recognition scoring tools, like Findclone, to track and identify possible extremists in unexpected positions of power, like neo-Nazis inside law enforcement agencies. Sébastien Bourdon, an independent journalist who investigates the far-right, said Findclone can show five preview matches — on a likelihood score between zero and one — of faces on social media platforms like Russia’s VK (VKontakte), and, importantly, it can even find images on deleted accounts. Investigative nonprofit Bellingcat has noted that systems like Findclone have “very limited, yet powerful, uses in looking for a person’s presence on VK,” but cautioned reporters to consider the significant ethical problems associated with facial recognition software, and to remember that these systems have been abused for nefarious purposes.
[Read more: Working with data? Here's how to verify your sources and numbers.]
Crowdsourcing
Try crowdsourcing data and evidence with tools like CrowdNewsroom. Marc Engelhardt, director of CrowdNewsroom Switzerland, said the tool allows journalists to launch crowdsourced campaigns, build a data story with an easy-to-use, drag-and-drop editing tool, and then analyze and verify the incoming information. “Citizens can share their data or personal stories through the platform in a safe manner,” he said.

Engelhardt said the independent platform Correctiv has already used CrowdNewsroom for several investigations, including tracking the money behind a poster campaign for a far-right European political party. The project drew data entries from 3,500 people.
As with an iceberg, the bulk of data-driven investigations — information extraction, cleaning, parsing, and converting — happens “below the waterline.”
Since this method depends on mobilizing the public, Engelhardt said successful projects need collaborations with NGOs and media partners, and offline promotion at community-based events.
Databases
Use the data power and flexibility of the Aleph tool from the Organized Crime & Corruption Reporting Project. OCCRP’s data editor, Jan Strozyk, recommended Aleph as an interactive global archive for investigative research. As with an iceberg, the bulk of data-driven investigations — information extraction, cleaning, parsing, and converting — happens “below the waterline,” which audiences generally don’t see. Strozyk said several features within the archive can help journalists with this less glamorous data work.
Aleph now includes 309 public datasets, 200 data scrapers, and data from more than 150 million entities. But Strozyk said the data platform also allows reporters to securely share their investigations with collaborators, upload almost any file type, search in various scripts, and turn data into clickable graphics that show onward connections.
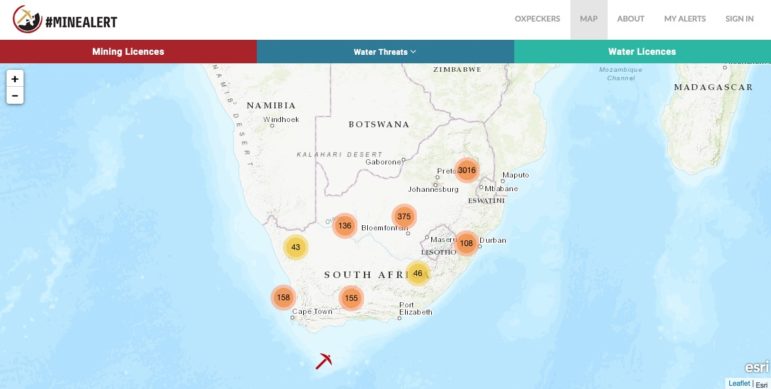
To map mining applications and regulation compliance in southern Africa — and to orient reporters elsewhere on how the coal industry works — check out the #MineAlerts tool developed by the Oxpeckersenvironmental investigations nonprofit. Andiswa Matikinca, a reporter and data manager at Oxpeckers, said the platform combines a digital database with a geo-journalism tool, and that it also includes documents related to license applications and operational mines, as well as the crucial issue of water-use around mines.
Similarly, the Offshore Leaks Database allows journalists to search for investigations involving companies that operate across borders. Delphine Reuter, a data journalist at the International Consortium of Investigative Journalists (ICIJ), said this free, open source database already contains data for 800,000 entities and that this number would soon swell with the addition of data from the Pandora Papers. Reuter also offered several tips for using the tool:
- Try alternate spellings in your search — like “limited” and “ltd,” or “corporation” and “corp.” — and use quotation marks around names.
- Take note of the listed source, and date, of data in the “Power Players” section of the database — which includes exposés like the Panama Papers and Paradise Papers — and remember that the data presented was a snapshot from the time of the investigation. Reuter said journalists should also check updated corporate registries for more recent data.
- While the database allows searches by name, address, or country, Reuter noted that it’s often important to search trusts and offshore companies under the “jurisdiction” category for accurate results.
[Read more: How to find and use data to report on conflict]
Country-Specific Resources
Be aware that there are new records databases for specific nations, like Ukraine and Kazakhstan. Dmitry Chaplinsky, IT specialist at Ukraine’s Bihus.info outlet, said reporters looking for public registries, asset disclosure documents, public procurement data, and other public records from Ukraine and Kazakhstan should check two new, regularly-updated, open source databases. Ring is a document search engine of over 20 databases in Ukraine with 29 million public records. Open Base is a similar data repository for Kazakhstan, with about a dozen data sources. Chaplinsky said Ring can be searched in Ukrainian, English, and Russian.
“My favorite tool of all is R and R Studio.” — Al Jazeera data editor Mohammad Haddad
A Reporting Toolbox for Use Everyday
While brand new tools are exciting, it can be equally valuable to learn the tools that investigative newsrooms rely on all the time. Mohammed Haddad, data editor at Al Jazeera Media Network, revealed the top five tools he uses every day.
- Mapbox — and the Mapbox Scrollytelling feature. “If you want to tell your story with geography, this is the tool,” said Haddad. “This is our favorite mapping tool, by far. You can take your readers on a journey around the world — we took our audience up the Nile River, and through the disputed border region between India and China.”
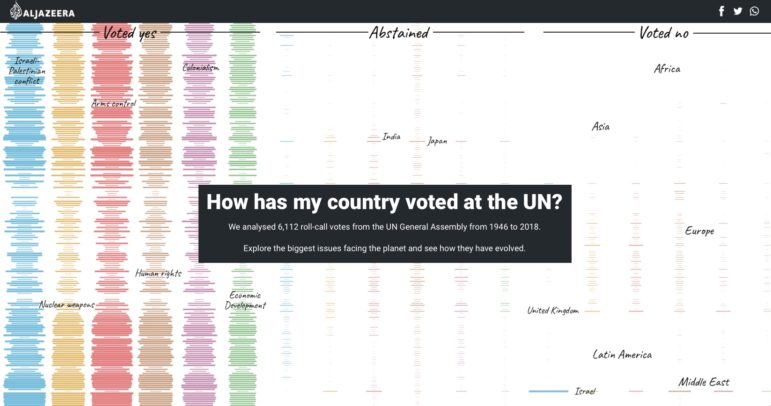
- Nivo. “This is a great data visualization tool that requires minimal code to set up very elaborate data visualizations,” Haddad explained. “Al Jazeera used Nivo to analyze how countries voted on issues at the UN since 1946.”
- AMP Stories. “Here is a mobile-first web storytelling platform that’s easy to digest. It’s great for character-led features, and it works great on mobile phones, where most of your traffic will likely come from,” he noted. “We used AMP Stories for our 100 Faces of Rohingya and our series that covered Black people killed in the United States, as well as in Palestine and Myanmar.”
- Chartbeat. “To understand how your story is resonating with your audience, use the real-time analytics of Chartbeat,” Haddad suggested. “To me, the most useful feature is the social media performance indicator, which helps you see where your story has been shared across social media.”
- R coding and R Studio. “My favorite tool of all is R and R Studio,” said Haddad. “Tools will come and go, so the best tool is one you can build in a programming language. R is used by our whole team, from gathering data through to editing. What can you do with R? — pretty much everything.”
One common and striking feature of the lightning round tools profiled by the panel was that they make seemingly overwhelming volumes of information manageable — and show that data contained in diverse languages, scripts, file types, and images are potentially searchable for any reporter online.
This article was originally published by the Global Investigative Journalism Network. It was republished on IJNet with permission.
Photo by UX Indonesia on Unsplash.