Updated Feb. 10, 2014 to reflect the new nickname of the Environmental News Lab.
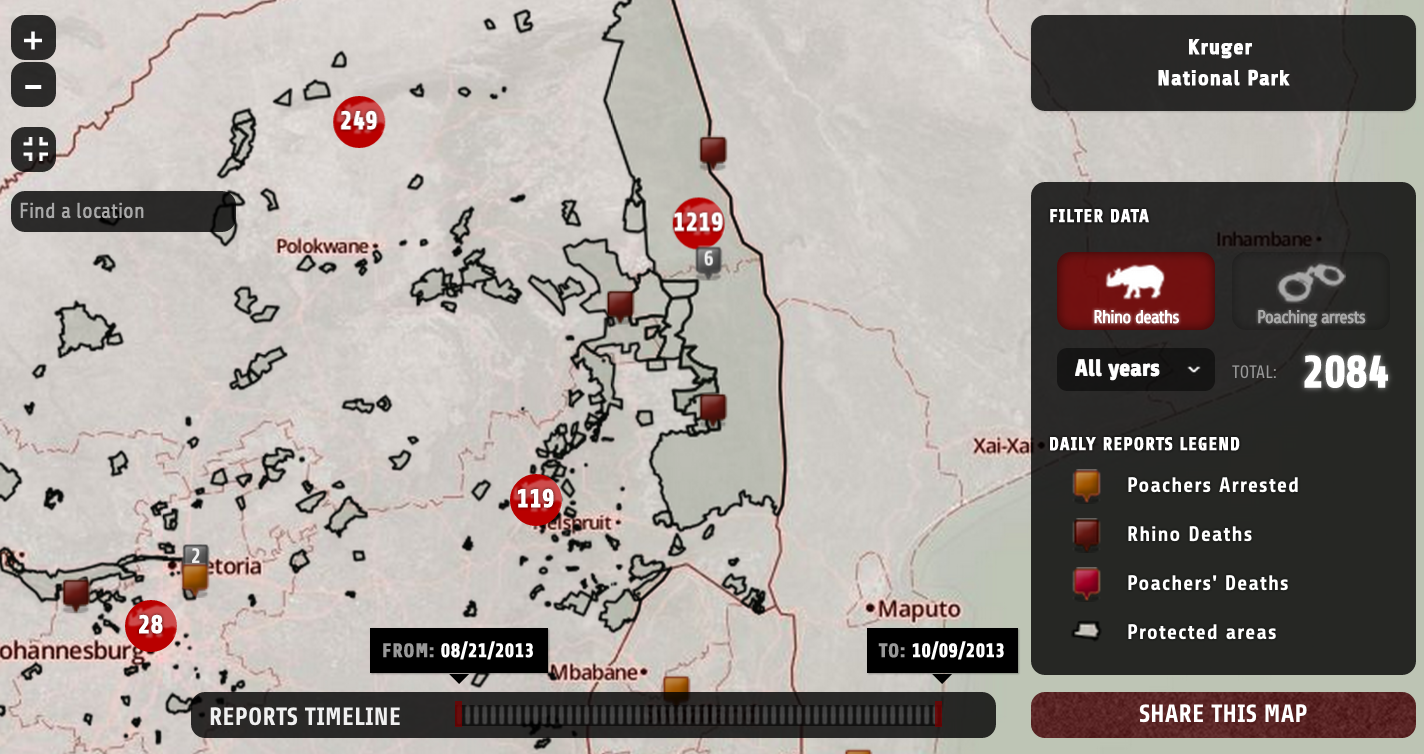
This year’s death toll of rhinos killed in South Africa by poachers - 635 animals so far - is on track to match the number killed in 2012, and to double the number killed three years ago. Most of this illegal hunting happens inside the country’s most famous national park, Kruger.
These striking statistics appear in a new interactive map built with a breakthrough set of tools that make it easier to track and display geographic data visually.
The Oxpeckers Center for Investigative Environmental Journalism, Africa’s first investigative reporting unit focusing on environmental issues, created the map with help from our team at the Environmental News Lab, also known as ((o))EcoLab. The map is part of a new online hub for data and geotagged news, which launched at the recent Global Investigative Journalism Conference in Rio de Janeiro.
To build it, we used data provided by the South African government, which for years has been fighting real wars against illegal hunting. In addition to displaying rhino poaching, the map also shows data on the deaths and arrests of poachers.
The Oxpeckers map builds on the experience and technology of InfoAmazonia, the geojournalism project launched during my first ICFJ Knight International Journalism Fellowship. InfoAmazonia was a dream that my partners and I struggled for years to make a reality. Now, just a year after its debut during the Rio + 20, the UN Conference on Sustainable Development, we’re inspiring journalists in other parts of the world and helping them build similar initiatives.
Helping our colleagues was one of the main reasons I helped found ((o))EcoLab this year as part of my second ICFJ Knight Fellowship. ((o))EcoLab creates tools to improve environmental coverage. A key tool we’ve built is JEO, an open source WordPress theme first used on InfoAmazonia, and now used to make the Oxpeckers interactive map a reality.
WordPress enables people to launch robust websites on their own without a developer. We created JEO as a WordPress theme so sites like O Eco and Oxpeckers can be powered by geographic data without needing developers to run them.
Forming a partnership with ((o))EcoLab was "the perfect platform for the Oxpeckers Center to showcase its investigations into environmental crimes in Southern Africa,” says Fiona Macleod, the chief editor of the Center. “The geo-narrative solution JEO provided for mapping rhino poaching proved to be an innovative model for combining traditional investigative reporting with data analysis. We plan to build on the model in our future investigations, in order to improve the quality and impact of African environmental journalism.”
Oxpeckers also seals an important partnership between my work in South America and that of ICFJ Knight International Journalism Fellow Justin Arenstein. Arenstein helped the African Media Initiative create the African News Innovation Challenge, which is currently the main source of funding for the environmental platform envisioned by Macleod, who also runs the main investigation published on the site, showing the links between local poaching and international traffic of ivory to countries like China and the U.S.
How JEO makes mapping easier
JEO enables journalists to more easily set up their own mapping projects. Here are a few of its key features:
-
Every post can be geotagged, making it easy to populate maps with content
-
You can choose different base layers from three mapping platforms: Stamen Maps, OpenStreet Map and MapQuest. Each of these platforms give you free satellite data for your map. Stamen also offers a very unique design.
-
Maps can be created directly on the WordPress Dashboard by using the APIs of mapping platforms MapBox and CartoDB. There are free and paid options for these platforms, depending on how much data you need to use. (For more on these platforms, read IJNet’s posts on CartoDB and MapBox.
-
It lets you create a timeline for navigating the posts on the map by choosing either numerical variables or date
- A distribution widget allow you to generate embed code of customized maps to use on other sites
Up next
The next project ((o))EcoLab will create with JEO will show the challenges of the environmental agenda in Indonesia. Ekuatorial, an initiative of Internews’ Earth Journalism Network, is an ambitious project featuring a set of maps with large amounts of data on deforestation, marine life and biodiversity issues. The project is also bringing together a great number of media organizations as partners. So far, 15 outlets have agreed to provide geotagged content to Ekuatorial.
The interest in JEO is inspiring us to make improvements to the platform during the next months. Our main challenges are to figure out better systems for the management of the geodata and to include features to allow citizen reporting, such as SMS gateways or linking social media to dynamic visualizations.
Partner with ((o))EcoLab and JEO
JEO uses open source tools, and you can fork the code on this page. If you use it, we would be interested in hearing about it and are happy to help answer any questions. Maybe we can even find a way to work together.
Gustavo Faleiros is an environmental journalist and media trainer who specializes in data journalism. He is a Knight International Journalism Fellow based in Brazil. You can follow him on Twitter.
Global media innovation content related to the projects and partners of the Knight Fellowships on IJNet is supported by the John S. and James L. Knight Foundation and edited by Jennifer Dorroh.
Image credits: Oxpeckers logo by Hebert Valois; screen shot of the Oxpeckers interactive map.