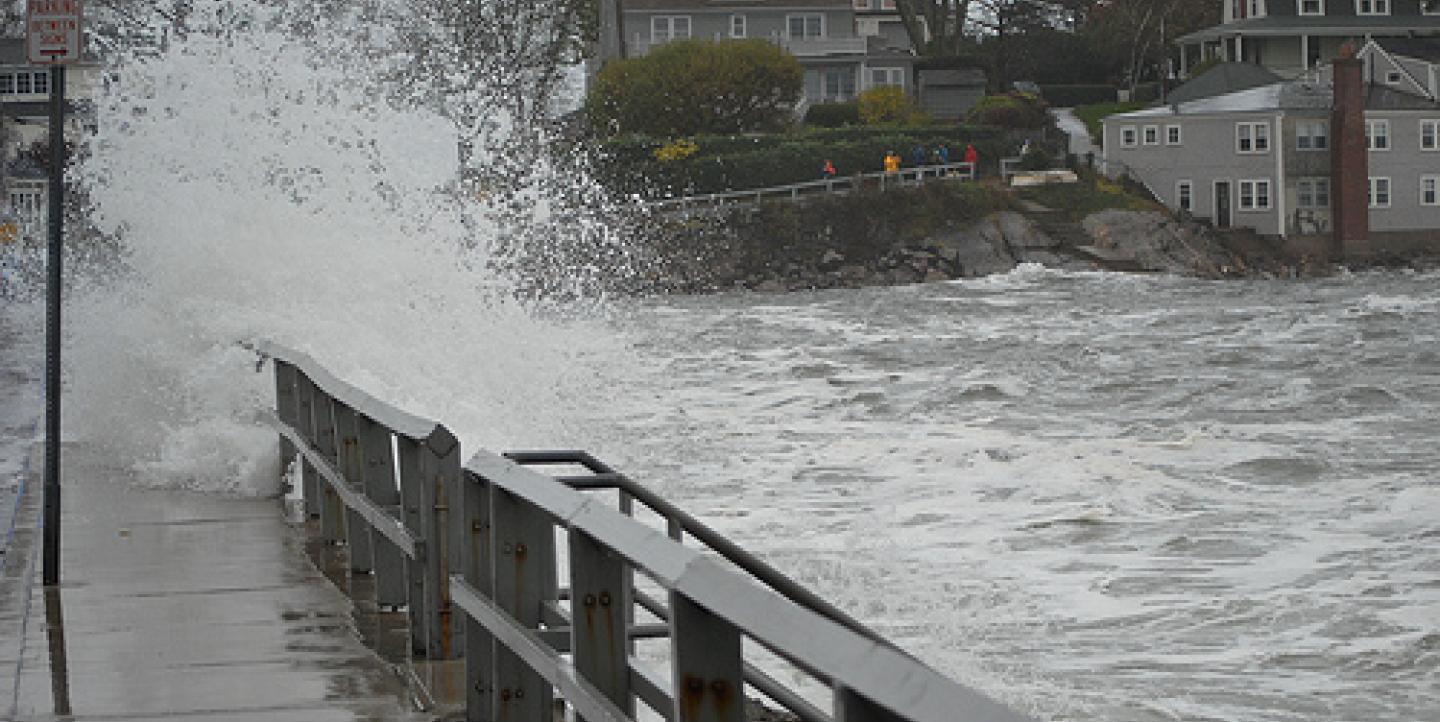
After lashing the Caribbean, Hurricane Sandy struck the U.S. East Coast, killing at least 30 people, inflicting especially severe damage in communities in New Jersey and New York, and leaving millions without electrical power.
Media outlets have been tracking Sandy (later downgraded to a superstorm) and its aftermath with every tool available, from live chats to interactive maps. Here's how they are covering the story:
- Live blogs
Many news outlets, such as CNN, are providing a steady flow of information on the storm and its aftermath with live blogs. Two more live blogs to watch are this one from the New York Observer, which offers constant updates on local happenings like bridge closures and rainfall, and the Reuters live blog.
- Live chats
Some East Coast news outlets hosted live chats ahead of and during the storm. These real-time forums, like those on NBC Washington and New Jersey’s Newark-based Star-Ledger, provide a public space for readers to share readiness tips and ask about the safety of specific spots.
- Webcams
In addition to photos and video, outlets are offering other resources for readers to keep a pulse on the storm in real time. This webcam list from Quartz provides views of New York, Long Island and the Jersey shore.
- Social media
Outlets including The Wall Street Journal and ABC News verified and compiled images from Twitter, Facebook and other social media platforms. (The Journal also cautioned that some of the images going viral were not in fact real).
Taking it one step further, a website created by New York Times R&D software architect Peter Ng and Facebook engineer Chris Ackermann called Instacane.org aggregates Instagram images posted with hurricane-related hashtags.
- Maps
Most news websites have posted radar imagery of Hurricane Sandy or produced features like The Washington Post's compilation of the seven "most alarming" map images of the storm. These efforts, however, are overshadowed by the map from Google's Crisis Response team, which uses data compiled by sources like the National Oceanic and Atmospheric Administration's [NOAA] National Hurricane Center and the U.S. Naval Research Laboratory. In addition to the map, it provides footage and information on shelters, evacuation and public alerts.
Have you seen other examples of storm coverage we should highlight? Please let us know in the comments.
Photo of Hurricane Sandy CC-licensed on Flickr, courtesy of the Brian Birke.

