A good visualization tool can help readers better retain information and more quickly understand complex subjects.
In a recent post, IJNet covered three easy data visualization tools for journalists. Here are two tools that require more advanced digital skills, but that will give you more options when you're working on your next big budget story:
AmCharts
AmCharts allows you to create Flash visualizations in a very simple way.
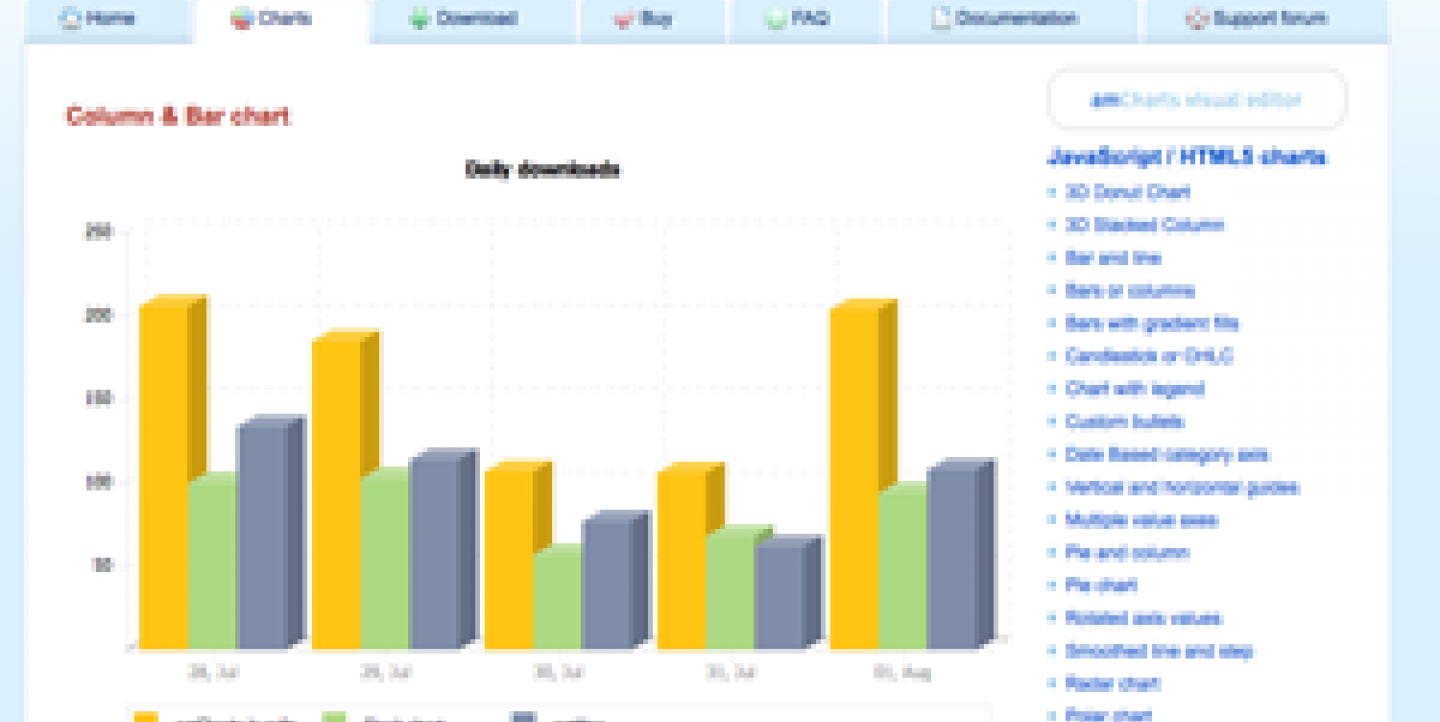
To start, go to amCharts.com and click on the "charts" tab. Then click on “amCharts visual editor,” in the upper right corner.
You can use this editor as a web service, and as it says in the page, all you need to do is create the chart and paste the generated HTML code in your HTML page. You don’t need to upload anything since the chart SWF files will be hosted on the amCharts server.
After that, select the type of chart you want. You can choose between column and bar, line and area, pie and donut, scatter and bubble, among others. Then the editor page will open. Using the column on the left you can enter the data and customize your chart by changing the color and appearance.
When you're done, click the HTML tab, check the "use SWF files hosted on amCharts" box under the HTML tab and then select “copy to clipboard.”
Paste the code in your page where you want it, the same way you would embed a YouTube video. An example of a chart made using amCharts can be found here.
Prezi
Prezi, an online free tool that allows you to tell a story in a non-linear, dynamic way, was created to move away from static PowerPoint presentations.
Prezi is a useful tool that allows you to create interactive infographics combining different types of media (photo, text and video). Dubbed by its creators the "zooming presentation editor," Prezi stands out for its non-linear storytelling capabilities and that zoom effect.
After you open an account, select “create new Prezi” and add a title and description. A brief tutorial will appear. Once done, you can start your presentation by pasting the elements and typing the text you want to include in your presentation using the menu in the upper left corner.
Once you have pasted the elements, you can then rotate them and adjust their size using the “zebra” tool. Using the “path” tool, you can set the path you want your presentation to follow. More advanced options help you create hidden frames to avoid clutter and use size and rotation to convey meaning to your presentations.
A free account gives you 100 MB of storage in Prezi.com and the ability to download your presentations and share them offline. You can also upgrade your account for an annual fee ranging from $60-$160 depending on features. It may seem a little overwhelming at first but there are plenty of tutorials to help you use this tool.
A nice example of what Prezi can do can be found here.

