
Last week, the Global Editors Network (GEN) held its fifth annual conference in Barcelona, where hundreds of journalists and editors convened with the purpose of merging content with technology.
Speakers like Samantha Barry from CNN, Serial’s Dana Chivvis and University of Southern California Associate Professor Robert Hernandez dove into topics like wearable technology, mobile web traffic and Chinese media innovation.
During the summit, GEN held its fourth annual Data Journalism Awards. In awards across ten categories, GEN recognized excellence in using data to explore trends and topics.
We looked at the list of winners this year and chose three that might inspire you for your next data journalism project:
Ojo Público (Peru), “Sworn Accounts: An analysis of changes in the wealth of Lima’s mayors”
Category winner: Best investigation of the year (small newsroom)
For Peru’s municipal and regional elections in October, a five-member team from Ojo Público designed a search engine in which any interested person could inquire about the finances of every Liman mayoral candidate. Of the incumbent candidates, many had previously faced or were currently facing allegations of corruption. With “Sworn Accounts,” a team of journalists and programmers led by Fabiola Torres López created the financial database to allow for greater transparency in their democracy.
The database included wealth analyses of 674 mayoral candidates, including 63 mayors, across 43 districts over the past 11 years. The wealth of data came from assets declared by each candidate, as well as sworn statements from each mayor. Users were encouraged to report any suspicious information they found, be it concealed assets or illegally acquired wealth.
After the database became active, a number of inconsistencies became apparent in the wealth of more than a dozen mayors. These discrepancies prompted the anticorruption attorney to launch an investigation.
BBC News, "Which Sport Are You Made For? Take Our 60 Second Test"
Category winner: Best news data app of the year (large newsroom)
This interactive app from BBC News, created by Bella Hurrell, is designed to get people off their couches and into the gym or onto the field. Using Glasgow’s Commonwealth Games to frame the app, the BBC asks readers to rate themselves on a scale of 1-10 for 12 different characteristics proposed by sports scientists at the University of Loughborough. Using questions that gauge attributes like aggressiveness (“If you were a curry, how spicy would you be?”) and pain tolerance (“Do you scream when you stub a toe?”), the app then creates a profile of the quizee and matches it to a list of sports that take place at the Commonwealth Games.
Hurrell and statisticians from the University of Winchester used R, software for statistical computing, to process the information, and D3 to design the graphic. During the course of the Commonwealth Games, the app was shared nearly 40,000 times on social media. In one day of traffic, the quiz received nearly 2 million unique visits.
After telling the reader which three sports (of an available 20) best fit their self-described abilities, the website directs them to local opportunities, getting them on the road to sporting success.
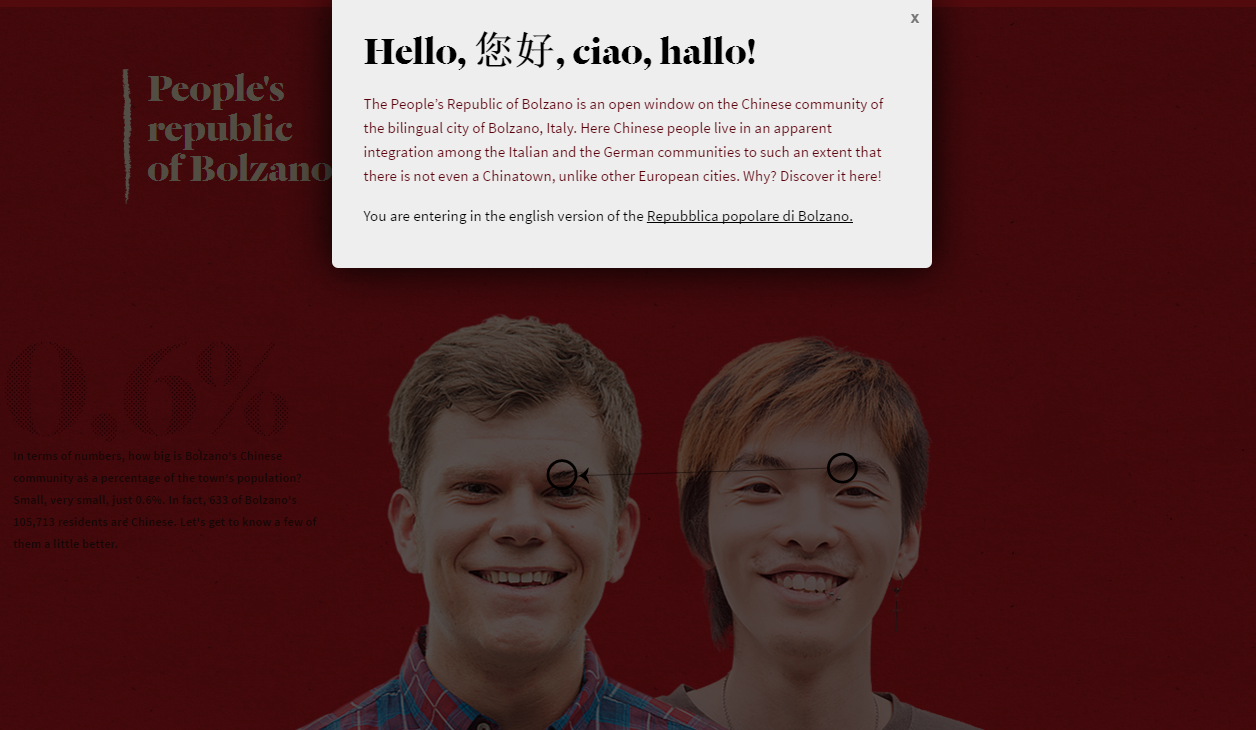
Libera Università di Bolzano (Italy), "People's Republic of Bolzano"
Category winner: Data visualization of the year (small newsroom)
In Bolzano, Italy, the local media insists that there is a massive influx of Chinese immigrants. In reality, only 0.6 percent of the city’s population is Chinese. To combat this negative public perception, Matteo Moretti and his team created a multimedia site to illustrate how unfounded the fears of locals have been.
Moretti and his team analyzed the impact of Chinese immigrants on Bolzano. The team used innovative graphics, such as a a timelapse map of Chinese-owned businesses from 1996 to the present. According to the report, the appearance of an “invasion” comes from the fact that Chinese residents go into retail businesses more frequently than other minorities, making their numbers seem larger from a subjective perspective.
On top of a solid dataset, Moretti sat down with a number of Chinese immigrants in Bolzano and talked about how these stereotypes have affected them and made living in Italy more difficult. The site uses D3 and Adobe products like Premiere, After Effects and Illustrator to deliver its story.
While the project was originally published in Italian in September 2014, the project was translated into English in February of 2015 with the hopes of reaching a wider audience.
See the full list of winners here.