Data journalism seems to be a scary concept for journalists in Pakistan. They tend to believe it involves learning how to write code, designing graphics using complex software and crunching numbers using hefty, mathematical formulas. There also is a general belief that there is little or no data available.
In fact, journalists do use data in stories about crime, health, business and education, among other areas. But there are no multidisciplinary teams, and there is rarely a specific need to crunch numbers from massive data sets (or even to find data sets and use them to build on a story).
One major challenge, however, is the heavy reliance on government-issued numbers. Take crime, for example. It is rare that a reporter will maintain his or her own database of incidents and then use that data to find trends such as what type of crime has been taking place in which area and at what time. It is even rarer that a journalist will use that data to extrapolate factors that contribute to a criminal act. (For instance, a broken street light resulting in muggings at the same spot).
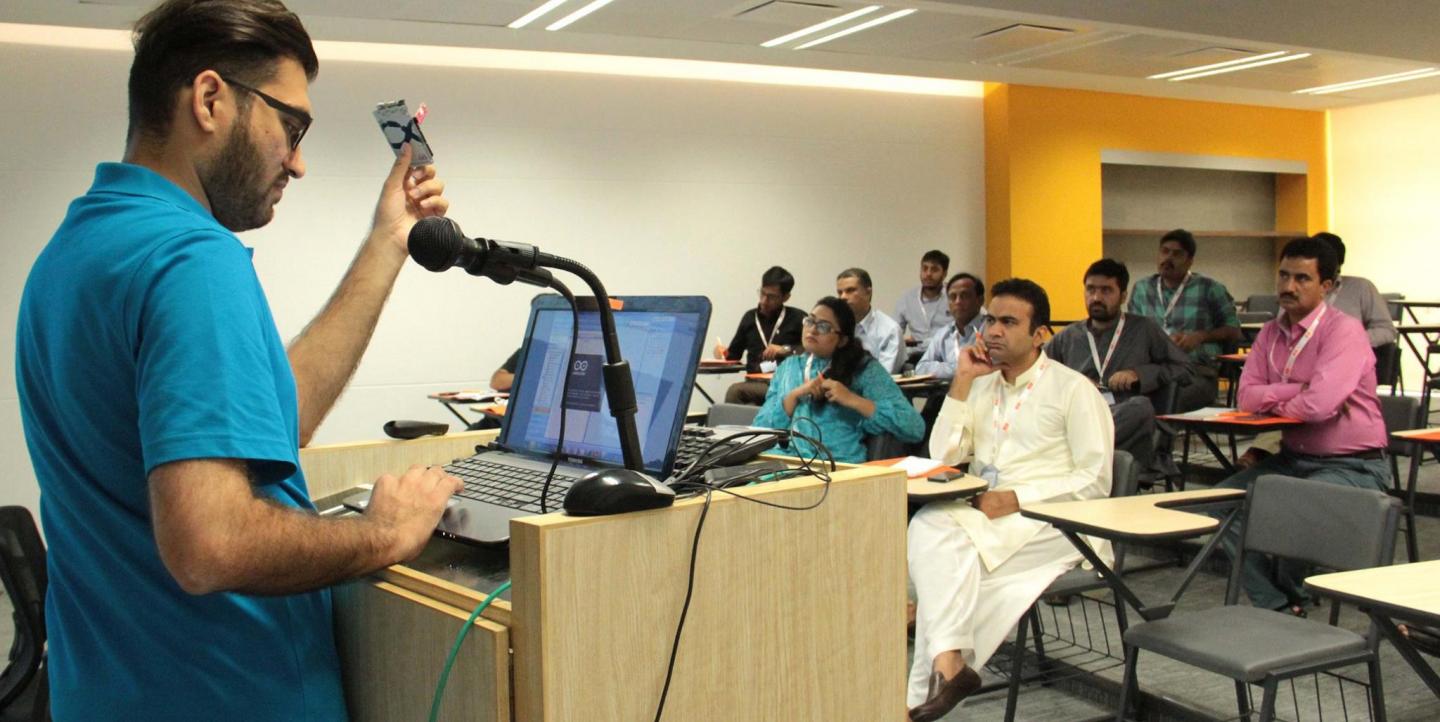
At the recent ICFJ Alumni Summit at the Centre for Excellence in Journalism in Karachi, more than 100 journalists went through an intense training program where they learned multiple disciplines. One of these was data journalism. The first step was overcoming the belief that there is no data available. Here are a few tips shared with the journalists during the trainings.
Where do we look for Pakistan-specific data?
One of the best resources for data in Pakistan is the Bureau of Statistics website. They have a number of data sets on social statistics, agriculture, mining, etc. If you see a data set you’d like to work with and it appears to be outdated, get in touch with the bureau for assistance.
All provinces in Pakistan have their own Bureau of Statistics as well.
For example:
One of the problems you will face when you find the data on these websites is that it’s all in PDF format. But that isn’t a big issue. You can use a number of free tools, such as Tabula and OpenRefine, to convert and clean up this data.
For election or parliamentarian data you can always look toward the Election Commission of Pakistan or the Open Parliament project. You will need to have some web scraping abilities to get hold of the data you’re looking for from these websites.
It is also always a good idea to head to association websites for industry-specific data. One example is the Pakistan Automotive Manufactures Association website, which has sales and manufacturing data for vehicles made in Pakistan.
Still need more? For education you can always try the Pakistan Data Portal or the Punjab Government’s school portal.
How to understand the data
Once you’ve got the data you need, and you’ve managed to extract it and clean it up, your next question will probably be, “Do I need to know math or code to analyze this data?”
No, you don’t. What you do need are basic Excel skills -- figure out how to work with sum, average, pivot tables, and how to make charts to present the data.
Thinking that you’ll have to go back to school to figure out the math or know a bit of code to work with data is one of the major reasons journalists in Pakistan tend to run from data journalism.
It is always good to start with the basics. But if you’re looking for something a little more advanced than Excel, consider Tableau. It is great for analyzing data and can help you build dashboards to better present the data to your readers.
Building interactive content and working with maps
If you’re looking to build interactive stories without learning how to code you can always take a look at easy to use, out-of-the-box tools like TimelineJS or StoryMapJS. These packages pick up your data from a spreadsheet and lay it out in a visually appealing and easy to explain format.
Before you start working with maps, it is always a good idea to read up on the kinds of maps there are and how they can support you with presenting your data. For any kind of mapping, you will need coordinates – the latitude and longitude. These can be found either through a smartphone or by using websites like Latlong.net. If you have a list of addresses you can use a batch geocoding service to get your latitudes and longitudes.
Your coordinates go into a spreadsheet like your data and it is then imported into services like CartoDB, Mapbox or Google to map your data.
Data journalism isn’t rocket science or extremely technical. Start small and build your way towards the more complex side of this discipline. And if you get stuck somewhere, need help opening up data sets or simply need support from developers, you can always head to your local Hacks/Hackers Pakistan chapter. We’d like nothing more than helping you out.
Shaheryar Popalzai is a digital journalist based in Pakistan and a co-founder of Hacks/Hackers Pakistan. Learn more about his work as an ICFJ Knight Fellow here.
Main image courtesy of the Center for Excellence in Journalism's Facebook page.

