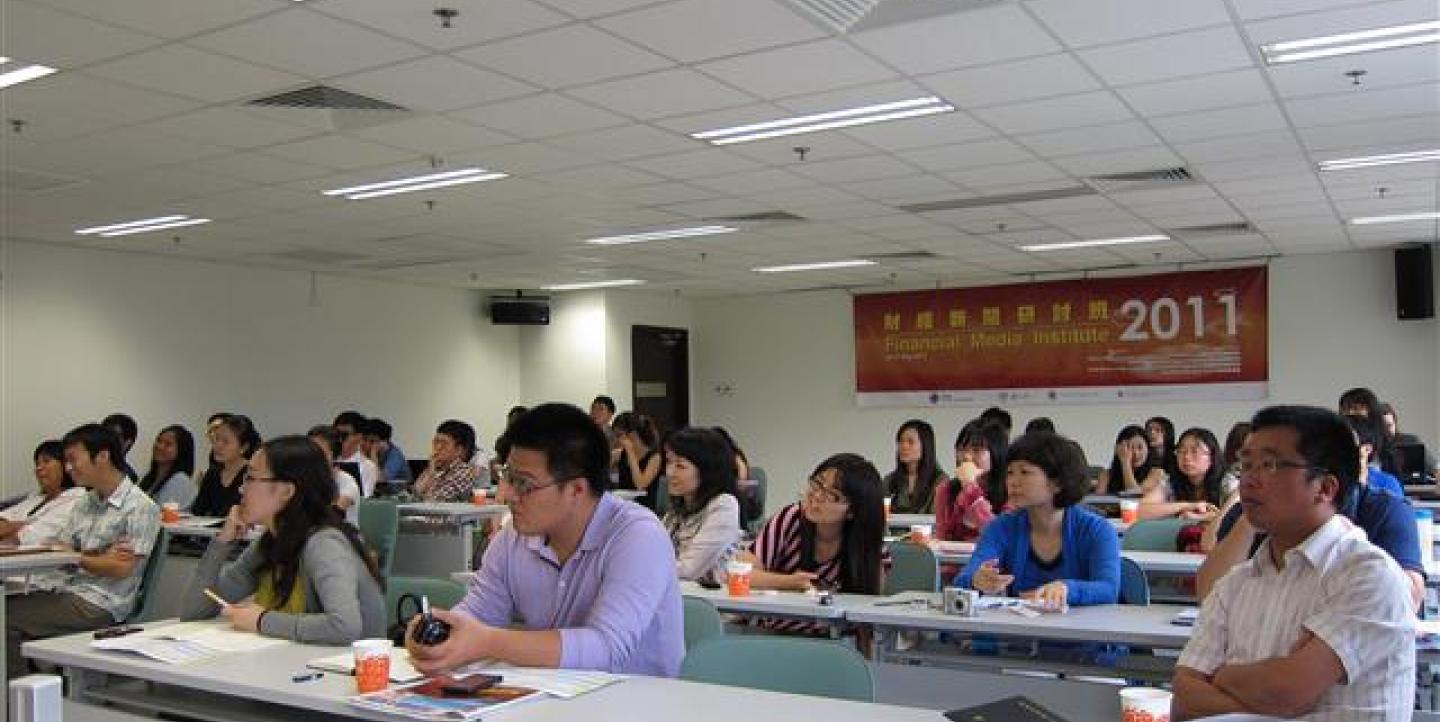
IJNet senior Chinese editor Yolanda Ma spoke at the Financial Media Institute 2011 held at the Hong Kong Baptist University. Here is an excerpt from her talk with tips for business journalists seeking resources on Hong Kong and Greater China.
Imagine you just landed an assignment for a business story but you have no Internet access. What would you do?
Students participating in the Financial Media Institute 2011 had obviously never considered this scenario – they suggested different ways of reporting the story including using the phone, pounding the pavement, etc.
But getting connected is the ultimate solution. Here's my point: Internet resources are a vital part of daily newsroom life. The question is how to find the right tools, so that reporters get stories done more efficiently and their labors result in more vivid stories. Keeping in mind how fast things change, here are some of my current favorite resources.
1. FIND DATA
If you need statistics, you probably needed them yesterday. Make sure to bookmark the main databases in your browser and review them every so often. To get started, try some of the most-used databases and directories on Hong Kong and China. (Thanks to Irene Jay Liu for introducing some of them to me):
- Hong Kong’s Census and Statistics Department a one-stop shop for government statistics on economic indicators, demographics, health, labor and many other areas.
- Hong Kong Exchange: Warehouse of information for companies listed in Hong Kong, including interim and annual reports plus required disclosures such as acquisitions of more than 15 percent of a company and senior management changes.
- Webb-site: An independent website that tracks Hong Kong company disclosures, news and other events. A good place to start, but remember to check the original sources.
2. FIND PEOPLE
Hong Kong has the advantage of obligatory transparency when it comes to information, while China lags behind with unpublicized data in most sectors. However, take Hong Kong’s public data with a grain of salt and double check before using it. Beware of directly citing press releases or government reports -- you never know how the information is being spun and parts of it may be false or disguised.
Once you find out more about the company that you're covering, figure out who the power brokers are. Here are some places to start:
- Renlifang: a search engine that pulls together different sources for background info and current articles on people, locations and organizations.
- WhoRunsHK: an interactive project of the South China Morning Post that connects the dots between the most influential people and organizations in Hong Kong. Check out this video on how SCMP used this database to write up the story on Stanley Ho’s family saga. The project has not been actively updated after January 2011, but is still worth exploring. (Full disclosure: Ma works for SCMP.)
- GlobalExperts: a free online resource of opinion leaders who can provide quick reactions and accurate analysis to journalists worldwide on complex political, social and religious issues and crises.
3.TELL BETTER STORIES
Let's assume your reporting is finished. Now what? You can turn that information into a quick 300-word business story or an 8,000-word feature story with all the dirty details. But what if your reader only has 10 minutes -- how can get your point across? Data visualization is an easy way to start and there are tons of free tools available.
- Google Public Data Explorer makes large datasets easy to explore, visualize and communicate. It's for “students, journalists, policy makers and everyone else (to) play with the tool to create visualizations of public data, link to them, or embed them in their own webpages.”
- ManyEyes lets you upload data and visualize it using a wide variety of interesting displays: maps, word trees, tag clouds, tree maps, bubble charts, matrix charts, network diagrams, etc. Check out the China-related data visualizations.
- Tableau Public (Windows only): Another free data visualization tool that helps you create interactive visualizations and embed it in your website or share it. Here is an example: China leads the world in renewable energy investment. A clear tutorial will get you started.
FINALLY: SHARPEN YOUR SKILLS
Ongoing education is key for journalists who want to stay on top of this information-overloaded, tech-savvy world. In addition to online courses, social media will also help you stay connected, helping you realize when you have fallen behind. Once you do, don’t panic: just ask for help, share ideas and you’ll come up with some great stories in the process.

